Drug activity z scores
This tool compiles drug activity levels from all NCI60 experiments the pass quality control.
The tool provides an Excel spreadsheet for each compound the user has input that includes:
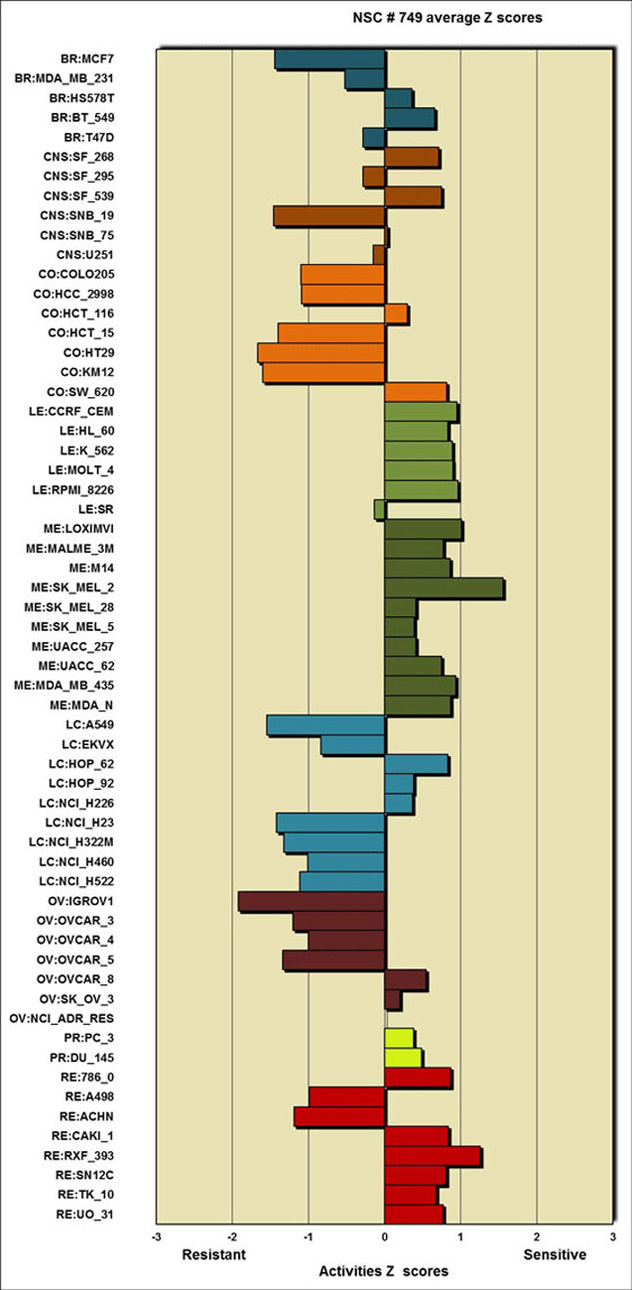
- average compound activity Z scores in a tabular form and visualized as a bar graph (see below).
- all activity values for those experiments that passed quality control to a maximum of 253
- the z-score transforms for each experiment that passed quality control to a maximum of 253.
The data, absent quality control and z score transforms, is queryable using Query Drug Data (http://discover.nci.nih.gov/cellminer/drugQuery.do).
The data can be downloaded in total at Download Data Sets under "Compounds: DTP NCI60" (http://discover.nci.nih.gov/cellminer/loadDownload.do).
A brief platform description is available in Data Set Metadata under "Drug: DTP_NCI60" (http://discover.nci.nih.gov/cellminer/datasets.do).
Drug activity levels expressed as 50% growth-inhibitory levels (GI50) are determined by the Developmental Therapeutics Program (DTP) (http://dtp.nci.nih.gov/) at 48 hours using
the sulforhodamine B assay (Rubenstein, J Natl Cancer Inst, 1990).
|
Table 1: Average compound activity Z scores |
|
| BR:MCF7 |
-1.44 |
| BR:MDA_MB_231 |
-0.52 |
| BR:HS578T |
0.36 |
| BR:BT_549 |
0.66 |
| BR:T47D |
-0.28 |
| CNS:SF_268 |
0.71 |
| CNS:SF_295 |
-0.28 |
| CNS:SF_539 |
0.75 |
| CNS:SNB_19 |
-1.46 |
| CNS:SNB_75 |
0.04 |
| CNS:U251 |
-0.15 |
| CO:COLO205 |
-1.1 |
| CO:HCC_2998 |
-1.09 |
| CO:HCT_116 |
0.3 |
| CO:HCT_15 |
-1.4 |
| CO:HT29 |
-1.67 |
| CO:KM12 |
-1.6 |
| CO:SW_620 |
0.82 |
| LE:CCRF_CEM |
0.95 |
| LE:HL_60 |
0.83 |
| LE:K_562 |
0.89 |
| LE:MOLT_4 |
0.9 |
| LE:RPMI_8226 |
0.97 |
| LE:SR |
-0.13 |
| ME:LOXIMVI |
1.01 |
| ME:MALME_3M |
0.77 |
| ME:M14 |
0.86 |
| ME:SK_MEL_2 |
1.56 |
| ME:SK_MEL_28 |
0.41 |
| ME:SK_MEL_5 |
0.39 |
| ME:UACC_257 |
0.41 |
| ME:UACC_62 |
0.75 |
| ME:MDA_MB_435 |
0.94 |
| ME:MDA_N |
0.87 |
| LC:A549 |
-1.55 |
| LC:EKVX |
-0.84 |
| LC:HOP_62 |
0.83 |
| LC:HOP_92 |
0.38 |
| LC:NCI_H226 |
0.37 |
| LC:NCI_H23 |
-1.42 |
| LC:NCI_H322M |
-1.32 |
| LC:NCI_H460 |
-1.01 |
| LC:NCI_H522 |
-1.11 |
| OV:IGROV1 |
-1.92 |
| OV:OVCAR_3 |
-1.2 |
| OV:OVCAR_4 |
-1 |
| OV:OVCAR_5 |
-1.34 |
| OV:OVCAR_8 |
0.55 |
| OV:SK_OV_3 |
0.2 |
| OV:NCI_ADR_RES |
0 |
| PR:PC_3 |
0.38 |
| PR:DU_145 |
0.49 |
| RE:786_0 |
0.87 |
| RE:A498 |
-0.99 |
| RE:ACHN |
-1.19 |
| RE:CAKI_1 |
0.84 |
| RE:RXF_393 |
1.26 |
| RE:SN12C |
0.81 |
| RE:TK_10 |
0.68 |
| RE:UO_31 |
0.77 |
|
| |
| |
|
|
|