HTS384 NCI-60 Drug Activity Z Scores
The tool provides an Excel spreadsheet for each compound the user has input that includes:
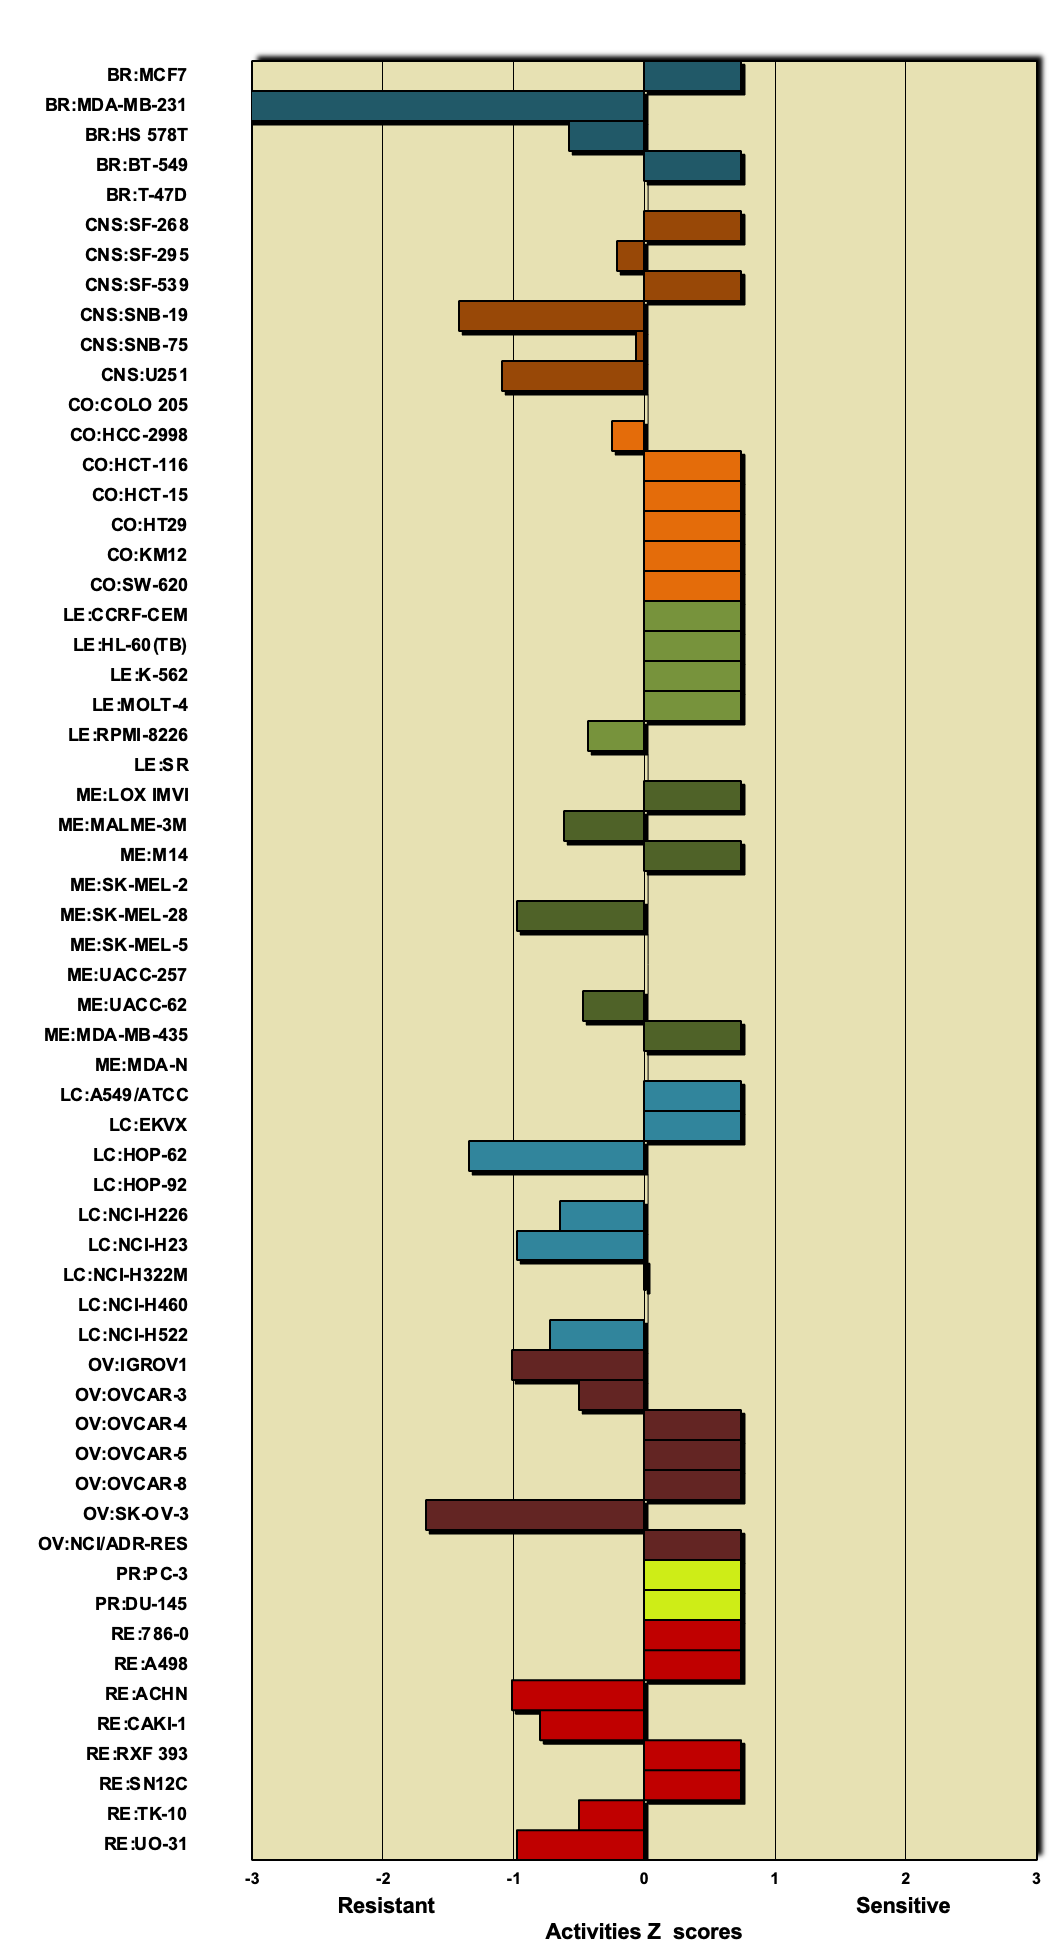
- Compound activity Z scores in a tabular form and visualized as a bar graph (see below).
- HTS384 NCI60 screening GI50 values for the experiment.
The data is queryable using Query Drug Data (http://discover.nci.nih.gov/cellminer/drugQuery.do).
The raw data can be downloaded in total at Download Data Sets page "DTP_HTS384_NCI60_RAW.zip" (http://discover.nci.nih.gov/cellminer/loadDownload.do).
The z-score data can be downloaded in total at Download Data Sets page "DTP_HTS384_NCI60_ZSCORE.zip" (http://discover.nci.nih.gov/cellminer/loadDownload.do).
A brief platform description is available in Data Set Metadata page under "Drug: Compound activity: DTP HTS384 NCI-60" (http://discover.nci.nih.gov/cellminer/datasets.do).
Raw luminescence values are normalized against vehicle controls, adjusted for background, and used to generate dose-response curves and calculate key endpoints GI50.
[PMID:38861359] HTS384 NCI60: The Next Phase of the NCI60 Screen
|
Table 1: Compound Activity Z Scores |
|
| BR:MCF7 |
0.731 |
| BR:MDA_MB_231 |
-4.400 |
| BR:HS578T |
-0.570 |
| BR:BT_549 |
0.731 |
| BR:T47D |
- |
| CNS:SF_268 |
0.731 |
| CNS:SF_295 |
-0.208 |
| CNS:SF_539 |
0.731 |
| CNS:SNB_19 |
-1.401 |
| CNS:SNB_75 |
0.064 |
| CNS:U251 |
-1.075 |
| CO:COLO205 |
- |
| CO:HCC_2998 |
-0.243 |
| CO:HCT_116 |
0.731 |
| CO:HCT_15 |
0.731 |
| CO:HT29 |
0.731 |
| CO:KM12 |
0.731 |
| CO:SW_620 |
0.731 |
| LE:CCRF_CEM |
0.731 |
| LE:HL_60 |
0.731 |
| LE:K_562 |
0.731 |
| LE:MOLT_4 |
0.731 |
| LE:RPMI_8226 |
-0.425 |
| LE:SR |
- |
| ME:LOXIMVI |
0.731 |
| ME:MALME_3M |
-0.606 |
| ME:M14 |
0.731 |
| ME:SK_MEL_2 |
- |
| ME:SK_MEL_28 |
-0.967 |
| ME:SK_MEL_5 |
- |
| ME:UACC_257 |
- |
| ME:UACC_62 |
-0.461 |
| ME:MDA_MB_435 |
0.731 |
| ME:MDA_N |
- |
| LC:A549 |
0.731 |
| LC:EKVX |
0.731 |
| LC:HOP_62 |
-1.328 |
| LC:HOP_92 |
- |
| LC:NCI_H226 |
-0.642 |
| LC:NCI_H23 |
-0.967 |
| LC:NCI_H322M |
0.009 |
| LC:NCI_H460 |
- |
| LC:NCI_H522 |
-0.714 |
| OV:IGROV1 |
-1.003 |
| OV:OVCAR_3 |
-0.497 |
| OV:OVCAR_4 |
0.731 |
| OV:OVCAR_5 |
0.731 |
| OV:OVCAR_8 |
0.731 |
| OV:SK_OV_3 |
-1.654 |
| OV:NCI_ADR_RES |
0.731 |
| PR:PC_3 |
0.731 |
| PR:DU_145 |
0.731 |
| RE:786_0 |
0.731 |
| RE:A498 |
0.731 |
| RE:ACHN |
-1.003 |
| RE:CAKI_1 |
-0.786 |
| RE:RXF_393 |
0.731 |
| RE:SN12C |
0.731 |
| RE:TK_10 |
-0.497 |
| RE:UO_31 |
-0.967 |
|
| |
| |
|
|
NSC 740 Compound Activity Z Scores
|