microRNA mean values
The microRNA mean values tool provides access to the average log2 intensity values for the Agilent Technologies Human miRNA Microarray (V2; ref. 9) for 360 microRNAs.
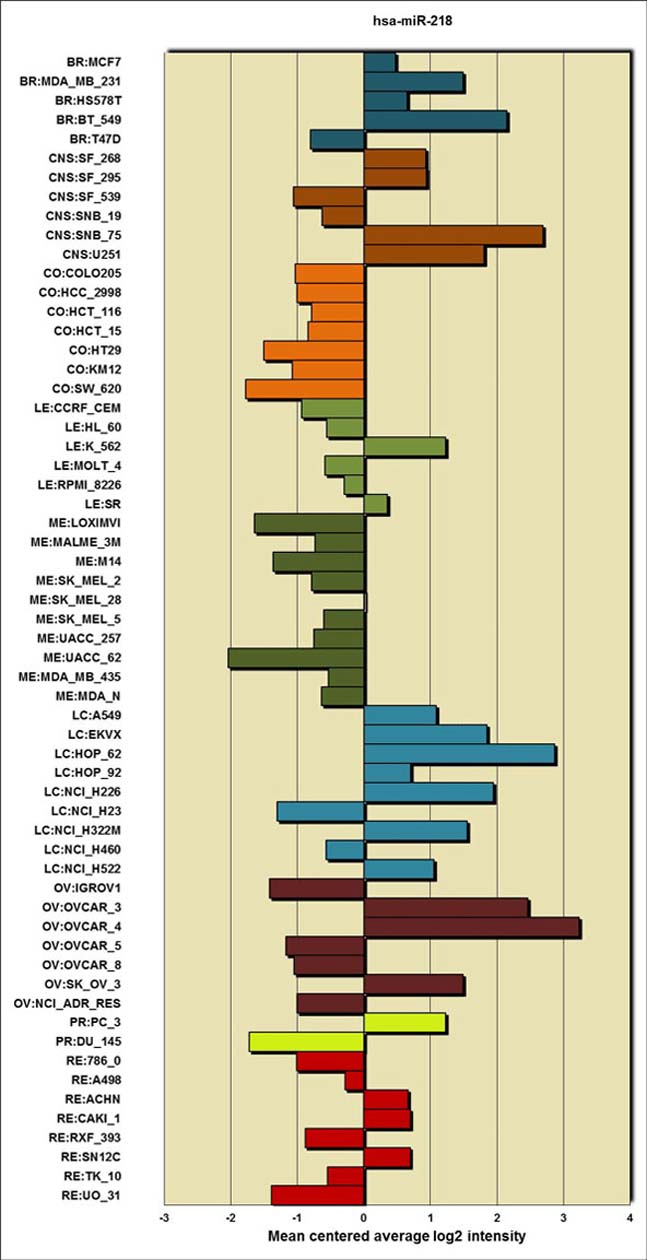
The tool provides an Excel spreadsheet for each microRNA the user has input that includes:
- mean centered microRNA intensities in tabular form and as a bar plot (see below)
- distribution of microRNA intensities by bin in tabular form and as a bar plot
The data is queryable by microRNA identifiers using Query Genomic Data under "RNA: Agilent Human microRNA (V2)" (http://discover.nci.nih.gov/cellminer/queryLoad.do).
The data can be downloaded in total at Download Data Sets under "RNA: Agilent Human microRNA (V2)" (http://discover.nci.nih.gov/cellminer/loadDownload.do).
A brief platform description is available in Data Set Metadata under "RNA: Agilent Human microRNA (V2)" (http://discover.nci.nih.gov/cellminer/datasets.do).
The microRNA intensities are measured as described in Liu et al, Mol Cancer Ther., 2010.
|
| Table 1: Mean centered log2 transcript intensities |
|
| BR:MCF7 |
0.48 |
| BR:MDA_MB_231 |
1.49 |
| BR:HS578T |
0.66 |
| BR:BT_549 |
2.15 |
| BR:T47D |
-0.8 |
| CNS:SF_268 |
0.94 |
| CNS:SF_295 |
0.94 |
| CNS:SF_539 |
-1.06 |
| CNS:SNB_19 |
-0.63 |
| CNS:SNB_75 |
2.69 |
| CNS:U251 |
1.81 |
| CO:COLO205 |
-1.03 |
| CO:HCC_2998 |
-1.00 |
| CO:HCT_116 |
-0.79 |
| CO:HCT_15 |
-0.84 |
| CO:HT29 |
-1.50 |
| CO:KM12 |
-1.07 |
| CO:SW_620 |
-1.78 |
| LE:CCRF_CEM |
-0.93 |
| LE:HL_60 |
-0.56 |
| LE:K_562 |
1.23 |
| LE:MOLT_4 |
-0.59 |
| LE:RPMI_8226 |
-0.29 |
| LE:SR |
0.35 |
| ME:LOXIMVI |
-1.65 |
| ME:MALME_3M |
-0.73 |
| ME:M14 |
-1.37 |
| ME:SK_MEL_2 |
-0.78 |
| ME:SK_MEL_28 |
0.01 |
| ME:SK_MEL_5 |
-0.60 |
| ME:UACC_257 |
-0.75 |
| ME:UACC_62 |
-2.04 |
| ME:MDA_MB_435 |
-0.53 |
| ME:MDA_N |
-0.64 |
| LC:A549 |
1.09 |
| LC:EKVX |
1.85 |
| LC:HOP_62 |
2.87 |
| LC:HOP_92 |
0.60 |
| LC:NCI_H226 |
1.95 |
| LC:NCI_H23 |
-1.30 |
| LC:NCI_H322M |
1.55 |
| LC:NCI_H460 |
-0.56 |
| LC:NCI_H522 |
1.06 |
| OV:IGROV1 |
-1.42 |
| OV:OVCAR_3 |
2.46 |
| OV:OVCAR_4 |
3.24 |
| OV:OVCAR_5 |
-1.17 |
| OV:OVCAR_8 |
-1.05 |
| OV:SK_OV_3 |
1.49 |
| OV:NCI_ADR_RES |
-1.01 |
| PR:PC_3 |
1.23 |
| PR:DU_145 |
-1.73 |
| RE:786_0 |
-1.01 |
| RE:A498 |
-0.28 |
| RE:ACHN |
0.67 |
| RE:CAKI_1 |
0.70 |
| RE:RXF_393 |
-0.88 |
| RE:SN12C |
0.70 |
| RE:TK_10 |
-0.55 |
| RE:UO_31 |
-1.39 |
|
| |
| |
| |
| |
| |
| |
| |
|
|
|
Average log2 intensities (not mean centered)
|
|
across all probes (based on rows) in table
|
| Range |
5.29 |
| Minimum |
-4.66 |
| Maximum |
0.63 |
| Average |
-2.613 |
| Standard Deviation |
1.314 |
|
|
microRNA
|
hsa-mir-218-1 |
hsa-mir-218-2 |
| Chromosome |
4 |
5 |
| Cytogenetic band |
4p15.31 |
5q34 |
| Start |
20529898 |
168195151 |
| End |
20530007 |
168195260 |
| Size |
109 |
109 |
| Orientation |
+ |
- |
|
|