Protein RPPA mean values
This tool provides access to the average log2 intensity values for protein lysates analyzed using 162 antibodies for 94 genes.
The tool provides an Excel spreadsheet for each gene the user has input that includes:
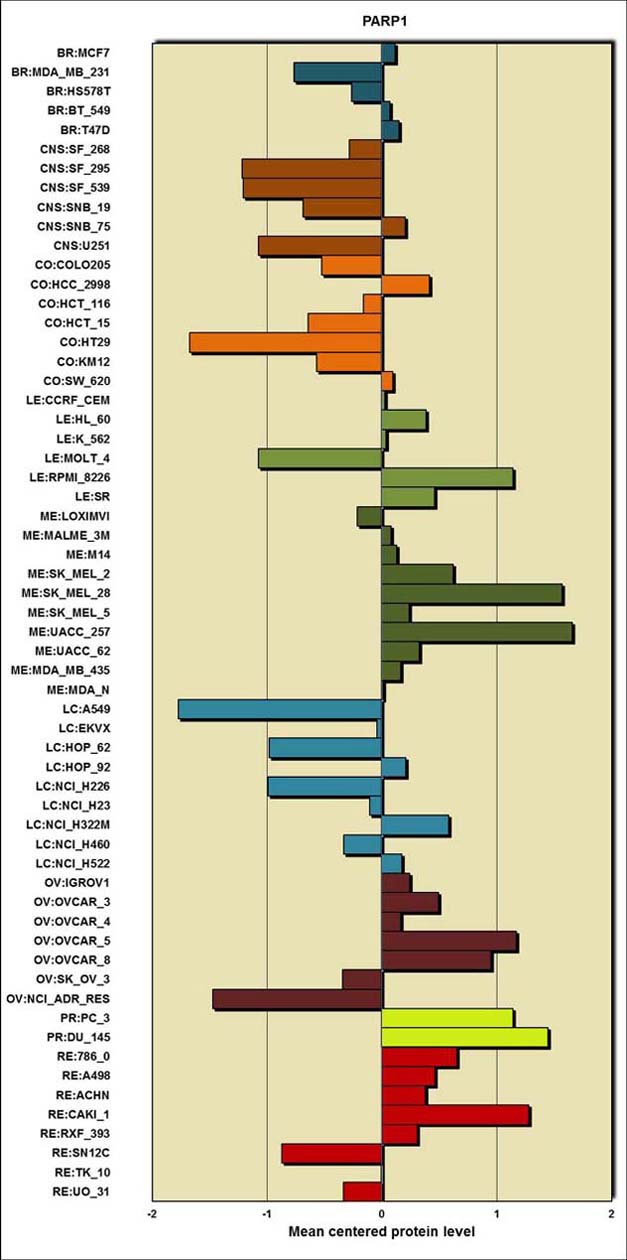
- mean centered protein levels in tabular form and as a bar plot (see below)
- a table of protein levels.
- distribution of protein levels by bin in tabular form and as a bar plot
The antibodies are as described in AbMiner (http://discover.nci.nih.gov/abminer/).
The data is queryable by gene or chromosomal location using Query Genomic Data under "Protein: Antibody Array DTB" (http://discover.nci.nih.gov/cellminer/queryLoad.do).
The data can be downloaded in total at Download Data Sets under "Protein: Antibody Array DTB" (http://discover.nci.nih.gov/cellminer/loadDownload.do).
A brief platform description is available in Data Set Metadata under "Protein: Antibody Array DTB" (http://discover.nci.nih.gov/cellminer/datasets.do).
The protein levels are measured as described in Nishizuka et al, Proc Natl Acad Sci USA, 2003.
|
Table 1: Mean centered protein levels |
|
| BR:MCF7 |
0.114 |
| BR:MDA_MB_231 |
-0.763 |
| BR:HS578T |
-0.263 |
| BR:BT_549 |
0.073 |
| BR:T47D |
0.151 |
| CNS:SF_268 |
-0.282 |
| CNS:SF_295 |
-1.216 |
| CNS:SF_539 |
-1.208 |
| CNS:SNB_19 |
-0.683 |
| CNS:SNB_75 |
0.204 |
| CNS:U251 |
-1.071 |
| CO:COLO205 |
-0.522 |
| CO:HCC_2998 |
0.415 |
| CO:HCT_116 |
-0.162 |
| CO:HCT_15 |
-0.643 |
| CO:HT29 |
-1.675 |
| CO:KM12 |
-0.565 |
| CO:SW_620 |
0.098 |
| LE:CCRF_CEM |
0.028 |
| LE:HL_60 |
0.385 |
| LE:K_562 |
0.039 |
| LE:MOLT_4 |
-1.073 |
| LE:RPMI_8226 |
1.141 |
| LE:SR |
0.46 |
| ME:LOXIMVI |
-0.212 |
| ME:MALME_3M |
0.082 |
| ME:M14 |
0.129 |
| ME:SK_MEL_2 |
0.62 |
| ME:SK_MEL_28 |
1.57 |
| ME:SK_MEL_5 |
0.24 |
| ME:UACC_257 |
1.656 |
| ME:UACC_62 |
0.327 |
| ME:MDA_MB_435 |
0.1163 |
| ME:MDA_N |
0.013 |
| LC:A549 |
-1.77 |
| LC:EKVX |
-0.041 |
| LC:HOP_62 |
-0.981 |
| LC:HOP_92 |
0.211 |
| LC:NCI_H226 |
-0.988 |
| LC:NCI_H23 |
-0.108 |
| LC:NCI_H322M |
0.583 |
| LC:NCI_H460 |
-0.33 |
| LC:NCI_H522 |
0.174 |
| OV:IGROV1 |
0.241 |
| OV:OVCAR_3 |
0.494 |
| OV:OVCAR_4 |
0.166 |
| OV:OVCAR_5 |
1.174 |
| OV:OVCAR_8 |
0.953 |
| OV:SK_OV_3 |
-0.342 |
| OV:NCI_ADR_RES |
-1.469 |
| PR:PC_3 |
1.14 |
| PR:DU_145 |
1.449 |
| RE:786_0 |
0.652 |
| RE:A498 |
0.461 |
| RE:ACHN |
0.38 |
| RE:CAKI_1 |
1.279 |
| RE:RXF_393 |
0.307 |
| RE:SN12C |
-0.869 |
| RE:TK_10 |
-0.006 |
| RE:UO_31 |
-0.335 |
|
|
|
|
|
|