RNA-seq gene expression values
This tool provides access to RNA-Sequencing gene expression values.
The tool provides an Excel spreadsheet for each gene the user has input that includes:
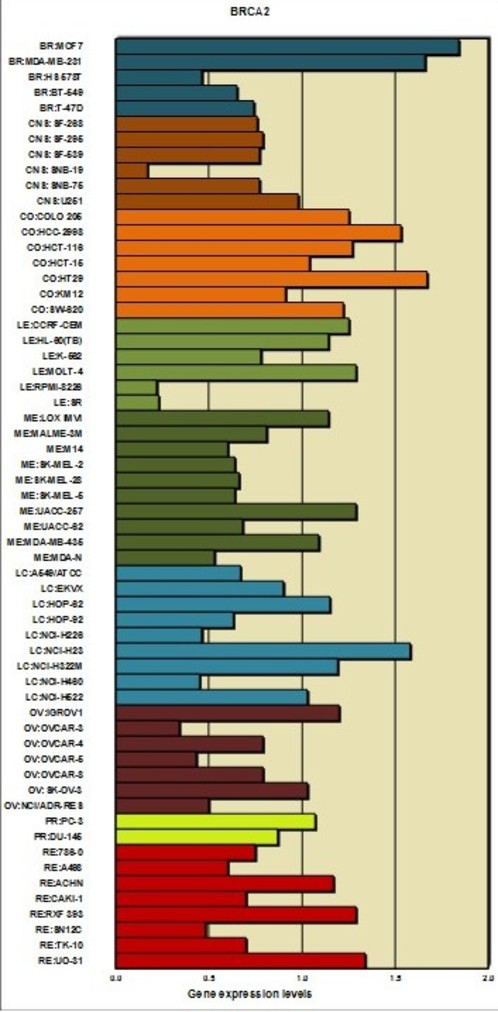
- RNA-Seq gene composite expression levels in tabular form and as a bar plot (see below)
- a table of individual isoform expression levels.
- distribution of RNA-Seq gene expression levels by bin in tabular form and as a bar plot
The data is queryable by gene or chromosomal location using Query Genomic Data under "RNA: RNA-seq" (http://discover.nci.nih.gov/cellminer/queryLoad.do)
and is available as a composite for the gene or by individual isoforms.
The data can be downloaded in total at Download Data Sets under "RNA: RNA-seq" (http://discover.nci.nih.gov/cellminer/loadDownload.do).
A brief platform description is available in Data Set Metadata under "RNA: RNA-seq" (http://discover.nci.nih.gov/cellminer/datasets.do).
|
| Table 1: RNA-Seq composite gene expression levels log2(FPKM + 1)b |
|
| BR:MCF7 | 1.84 |
|---|
| BR:MDA-MB-231 | 1.66 |
| BR:HS 578T | 0.46 |
| BR:BT-549 | 0.65 |
| BR:T-47D | 0.74 |
| CNS:SF-268 | 0.76 |
| CNS:SF-295 | 0.79 |
| CNS:SF-539 | 0.77 |
| CNS:SNB-19 | 0.17 |
| CNS:SNB-75 | 0.77 |
| CNS:U251 | 0.98 |
| CO:COLO 205 | 1.25 |
| CO:HCC-2998 | 1.53 |
| CO:HCT-116 | 1.27 |
| CO:HCT-15 | 1.04 |
| CO:HT29 | 1.67 |
| CO:KM12 | 0.91 |
| CO:SW-620 | 1.22 |
| LE:CCRF-CEM | 1.25 |
| LE:HL-60(TB) | 1.14 |
| LE:K-562 | 0.78 |
| LE:MOLT-4 | 1.29 |
| LE:RPMI-8226 | 0.22 |
| LE:SR | 0.23 |
| ME:LOX IMVI | 1.14 |
| ME:MALME-3M | 0.81 |
| ME:M14 | 0.6 |
| ME:SK-MEL-2 | 0.64 |
| ME:SK-MEL-28 | 0.66 |
| ME:SK-MEL-5 | 0.64 |
| ME:UACC-257 | 1.29 |
| ME:UACC-62 | 0.68 |
| ME:MDA-MB-435 | 1.09 |
| ME:MDA-N | 0.53 |
| LC:A549/ATCC | 0.67 |
| LC:EKVX | 0.9 |
| LC:HOP-62 | 1.15 |
| LC:HOP-92 | 0.63 |
| LC:NCI-H226 | 0.46 |
| LC:NCI-H23 | 1.58 |
| LC:NCI-H322M | 1.19 |
| LC:NCI-H460 | 0.45 |
| LC:NCI-H522 | 1.03 |
| OV:IGROV1 | 1.2 |
| OV:OVCAR-3 | 0.34 |
| OV:OVCAR-4 | 0.79 |
| OV:OVCAR-5 | 0.43 |
| OV:OVCAR-8 | 0.79 |
| OV:SK-OV-3 | 1.03 |
| OV:NCI/ADR-RES | 0.5 |
| PR:PC-3 | 1.07 |
| PR:DU-145 | 0.87 |
| RE:786-0 | 0.75 |
| RE:A498 | 0.6 |
| RE:ACHN | 1.17 |
| RE:CAKI-1 | 0.7 |
| RE:RXF 393 | 1.29 |
| RE:SN12C | 0.48 |
| RE:TK-10 | 0.7 |
| RE:UO-31 | 1.34 |
|
|
|