Gene transcript z scores
This tool compiles all non-degenerate transcript probe data from five microarray platforms.
The tool provides an Excel spreadsheet for each gene the user has input that includes:
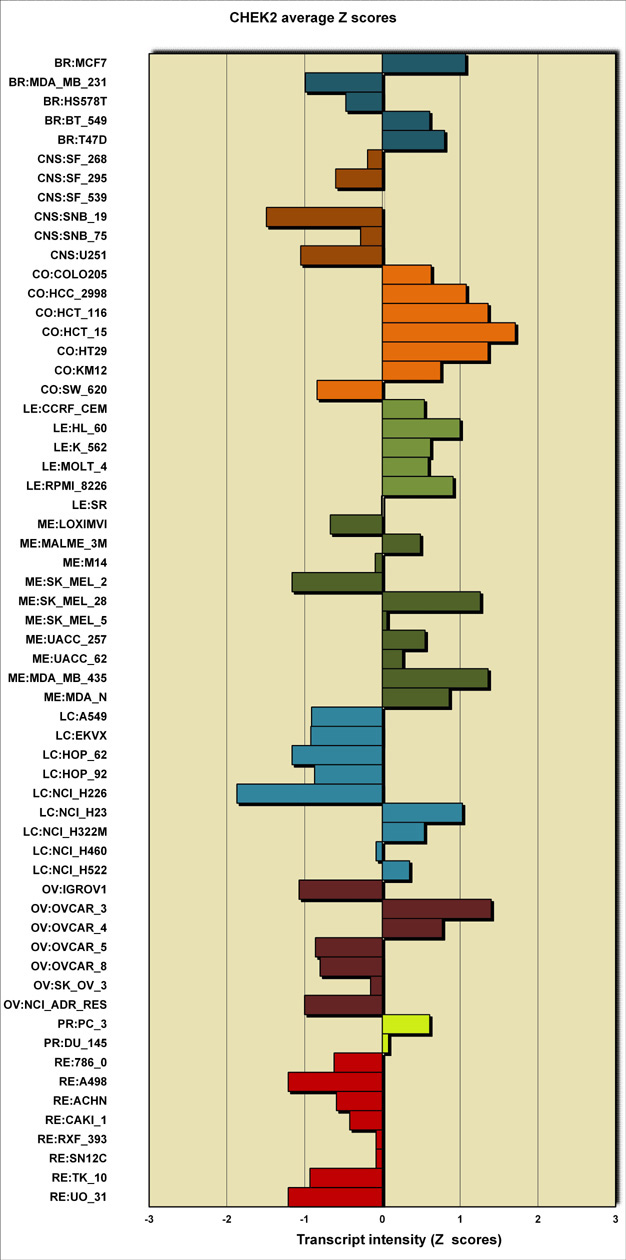
- average intensity Z scores in a tabular form and visualized as a bar graph (see below).
- intensity values for those probes that passed quality control to a maximum of 253
- the z-score transforms for each probe that passed quality control to a maximum of 253.
The data can be downloaded in total at Download Data Sets under "RNA: 5 Platform Gene Transcript" (http://discover.nci.nih.gov/cellminer/loadDownload.do).
A brief platform description is available in Data Set Metadata under "RNA: 5 Platform Gene Transcript" (http://discover.nci.nih.gov/cellminer/datasets.do).
|
CHEK2
|
[GeneCards] |
| Chromosome |
22 |
| Cytogenetic band |
q12.2 |
| Start |
29083730 |
| End |
29137821 |
| Size |
54091 |
| Orientation |
- |
|
Table 1: Average transcript intensity Z scores |
|
| BR:MCF7 |
1.31 |
| BR:MDA_MB_231 |
-1.01 |
| BR:HS578T |
-0.39 |
| BR:BT_549 |
0.88 |
| BR:T47D |
0.64 |
| CNS:SF_268 |
-0.49 |
| CNS:SF_295 |
-0.69 |
| CNS:SF_539 |
na |
| CNS:SNB_19 |
-1.39 |
| CNS:SNB_75 |
-0.42 |
| CNS:U251 |
-0.96 |
| CO:COLO205 |
0.49 |
| CO:HCC_2998 |
1.04 |
| CO:HCT_116 |
1.23 |
| CO:HCT_15 |
1.62 |
| CO:HT29 |
1.35 |
| CO:KM12 |
0.75 |
| CO:SW_620 |
-0.92 |
| LE:CCRF_CEM |
0.61 |
| LE:HL_60 |
1.28 |
| LE:K_562 |
0.93 |
| LE:MOLT_4 |
0.66 |
| LE:RPMI_8226 |
1.09 |
| LE:SR |
0.12 |
| ME:LOXIMVI |
-0.91 |
| ME:MALME_3M |
0.12 |
| ME:M14 |
-0.34 |
| ME:SK_MEL_2 |
-1.22 |
| ME:SK_MEL_28 |
1.36 |
| ME:SK_MEL_5 |
-0.12 |
| ME:UACC_257 |
0.36 |
| ME:UACC_62 |
0.20 |
| ME:MDA_MB_435 |
1.02 |
| ME:MDA_N |
0.50 |
| LC:A549 |
-0.76 |
| LC:EKVX |
-1.01 |
| LC:HOP_62 |
-1.01 |
| LC:HOP_92 |
-0.85 |
| LC:NCI_H226 |
-1.79 |
| LC:NCI_H23 |
0.97 |
| LC:NCI_H322M |
0.67 |
| LC:NCI_H460 |
0.05 |
| LC:NCI_H522 |
0.56 |
| OV:IGROV1 |
-0.87 |
| OV:OVCAR_3 |
1.60 |
| OV:OVCAR_4 |
0.98 |
| OV:OVCAR_5 |
-0.93 |
| OV:OVCAR_8 |
-0.82 |
| OV:SK_OV_3 |
-0.25 |
| OV:NCI_ADR_RES |
-0.90 |
| PR:PC_3 |
0.32 |
| PR:DU_145 |
0.05 |
| RE:786_0 |
-0.58 |
| RE:A498 |
-1.08 |
| RE:ACHN |
-0.61 |
| RE:CAKI_1 |
-0.40 |
| RE:RXF_393 |
-0.28 |
| RE:SN12C |
0.06 |
| RE:TK_10 |
-0.59 |
| RE:UO_31 |
-1.18 |
|
| |
| |
| |
| |
| |
| |
| |
|
|
|