
Tools
The Miner Suite of Bioinformatic Applications
These applications are freely available for public use. Our characterization and analysis of the NCI-60 cancer cell lines, the DNA, RNA, protein, epigenetic and pharmacological levels is accessible through CellMiner, with the expended version including additional cell line sets available through CellMinerCDB.
TumorMinerCDB: SCLC
TumorMinerCDB: SCLC is an interactive web application designed to support small cell lung cancer (SCLC) research and precision oncology. The platform integrates genomic, transcriptomic, clinical, and biomarker data from 204 SCLC tumor samples, including both untreated and relapsed cases, to help users explore tumor subtypes, molecular pathways, mutation patterns, prognostic markers, and potential therapeutic targets. Built to make complex RNA-seq and clinical data easier to interpret, the application provides intuitive tools for comparing samples, identifying biomarkers such as DLL3, TROP2, SEZ6, and SLFN11, and examining biologic differences between newly diagnosed and treatment-resistant disease.
A distinctive feature of TumorMinerCDB: SCLC is its MyPatient module, which serves as a prototype for individualized tumor assessment by classifying samples and highlighting biomarkers that may inform prognosis and treatment selection. By combining accessible visualization tools with clinically relevant molecular insights, TumorMinerCDB: SCLC provides a practical resource for researchers and clinicians working to advance biomarker-driven care and precision medicine in SCLC.
CellMinerCDB
CellMiner Cross Database (CDB) is the first web application to allow translational researchers to conduct analyses across all major cancer cell line pharmacogenomic data sources from NCI-DTP NCI-60, Sanger GDSC, and Broad CCLE/CTRP. It provides matched molecular and drug activity profiling data. This data may be used to 1) assess molecular and drug data reproducibility, 2) determine repositioning opportunities for FDA-approved compounds, 3) identify potential drug response and gene regulatory determinants, and 4) identify and validate novel genes associated with phenotypic processes. This data is an important precision medicine resource. Augustin Luna, Fathi Elloumi, Sudhir Varma, Yanghsin Wang, Vinodh N. Rajapakse, Mirit I. Aladjem, Jacques Robert, Chris Sander, Yves Pommier and William C. Reinhold, Nucleic Acids Research, January 2021
CellMinerCDB: Small Cell Lung Cancer (SCLC)
CellMinerCDB: Small Cell Lung Cancer is configured like CellMinerCDB with additional features and focuses on SCLC cell lines from various data sources. Camille Tlemsani, Lorinc Pongor, Fathi Elloumi, Luc Girard, Kenneth E. Huffman, Nitin Roper, Sudhir Varma, Augustin Luna, Vinodh N. Rajapakse, Robin Sebastian, Kurt W. Kohn, Julia Krushkal, Mirit I. Aladjem, Beverly A. Teicher, Paul S. Meltzer, William C. Reinhold, John D. Minna, Anish Thomas and Yves Pommier, Cell Reports, October, 2020
CellMinerCDB: Sarcoma
CellMinerCDB: Sarcoma is a specialized platform derived from CellMinerCDB, tailored for sarcoma research. It offers comprehensive data on 133 sarcoma cell lines, integrating various omics data sources. The platform ensures reproducibility and biological relevance, empowering researchers with tools to explore and test hypotheses in translational research. Its aim is to advance preclinical studies in sarcoma for improved understanding and treatment development. Camille Tlemsani; Christine M. Heske; Fathi Elloumi; Lorinc Pongor; Prashant Khandagale; Sudhir Varma; Paul S. Meltzer; Javed Khan; William C. Reinhold; Yves Pommier, iScience, April, 2024
CellMinerCDB: Adenoid Cortical Carcinoma (ACC)
CellMinerCDB: Adrenal Cortical Carcinoma (ACC) is a substantive genomic and drug sensitivity database comprising ACC cell lines, patient-derived xenografts, surgical samples, and responses to more than 2,400 drugs examined by the NCI and National Center for Advancing Translational Sciences. This database exposes shared genomic pathways among ACC cell lines and surgical samples, thus authenticating the cell lines as research models. It also allows exploration of pertinent treatment markers such as MDR-1, SOAT1, MGMT, MMR, and SLFN11 and introduces the potential to repurpose agents like temozolomide for ACC therapy. CellMinerCDB:ACC provides the foundation for exploring larger preclinical ACC models. Yasuhiro Arakawa, Fathi Elloumi, Sudhir Varma, Prashant Khandagale, Ukhyun Jo, Suresh Kumar, Nitin Roper, William C. Reinhold, Robert W. Robey, Naoko Takebe, Michael M. Gottesman, Craig J. Thomas, Valentina Boeva, Alfredo Berruti, Andrea Abate, Mariangela Tamburello, Sandra Sigala, Constanze Hantel, Isabel Weigand, Margaret E. Wierman, Katja Kiseljak-Vassiliades, Jaydira Del Rivero, Yves Pommier, AACR Cancer Research Communications, September, 2024
CellMinerCDB: National Center for Advancing Translational Sciences (NCATS)
A powerful tool for precision medicine: CellMinerCDB: NCATS exposes relationships between cancer cells' molecular makeup and their response to potential therapies, using data on thousands of compounds screened at the National Center for Advancing Translational Sciences. William C. Reinhold, Kelli Wilson, Fathi Elloumi, Katie R. Bradwell, Michele Ceribelli, Sudhir Varma, Yanghsin Wang, Damien Duveau, Nikhil Menon, Jane Trepel, Xiaohu Zhang, Carleen Klumpp-Thomas, Samuel Michael, Paul Shinn, Augustin Luna, Craig Thomas, Yves Pommier, AACR Journals, May 2023
CellMiner (NCI-60)
A database and query tool designed for the cancer research community to facilitate integration of the molecular datasets generated by the Genomics and Pharmacology Facility and its collaborators on the NCI-60. William C. Reinhold, Margot Sunshine, Hongfang Liu, Sudhir Varma, Kurt W. Kohn, Joel Morris, James Doroshow, and Yves Pommier Cancer Research, July 2012
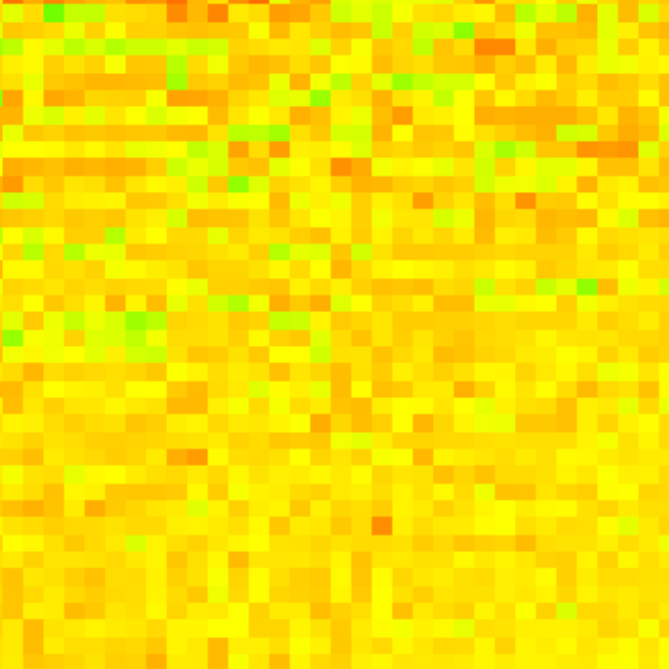
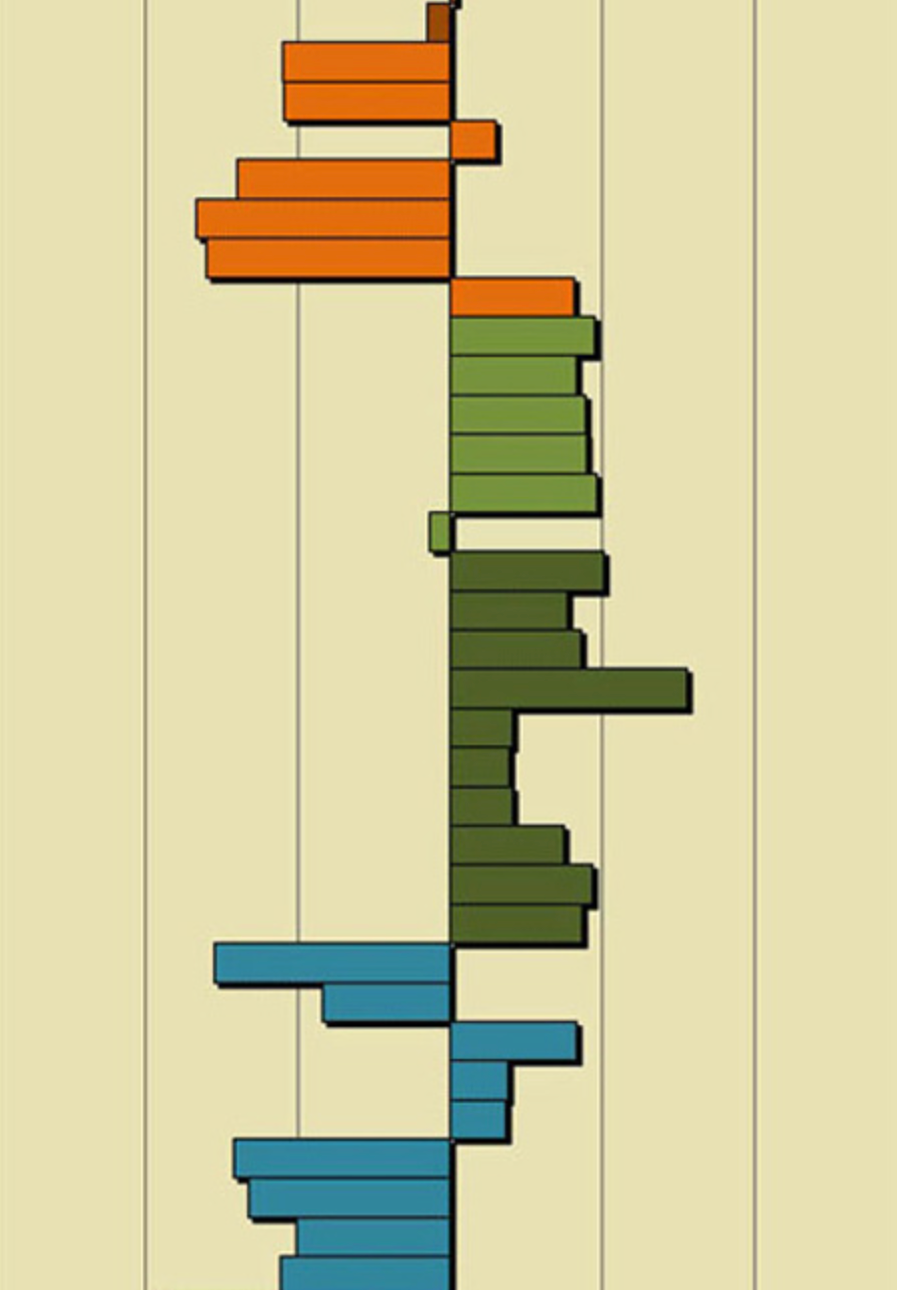
CIMMiner
Generates color-coded Clustered Image Maps (CIMs) ("heat maps") to represent high-dimensional data sets such as gene expression profiles. We introduced CIMs in the mid-1990’s for data on drug activity, target expression, gene expression, and proteomic profiles. Clustering of the axes brings like together with like to create patterns of color. Weinstein, et al., Science Jan 1997; 275:343-349
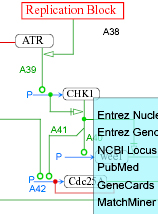
MIMminer
A Molecular Interaction Map (MIM) is a diagram convention that is capable of unambiguous representation of networks containing multi-protein complexes, protein modifications, and enzymes that are substrates of other enzymes. This graphical representation makes it possible to view all of the many interactions in which a given molecule may be involved, and it can portray competing interactions, which are common in bioregulatory networks. In order to facilitate linkage to databases, each molecular species is represented only once in a diagram. A formal description of the MIM notation can be found in Kohn et al., Molecular Biology of the cell 17, 1-13 2006. The updated formal specification for software implementation can be found in Luna et al., BMC Bioinformatics 2011, 12:167.