Drug almanac combo scores
The tool provides an Excel spreadsheet for each compound the user has input that includes:
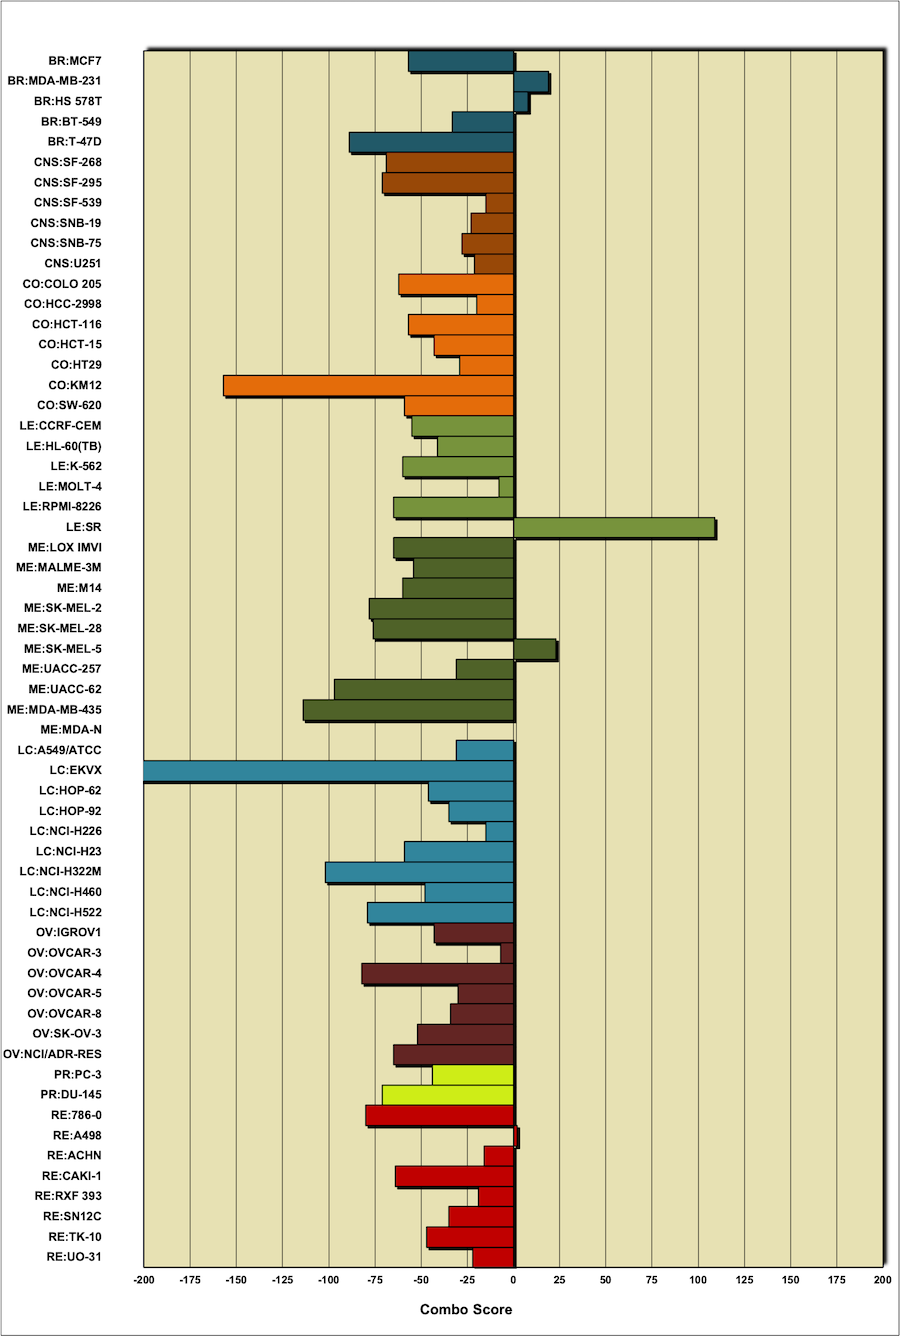
- combo scores in a tabular form and visualized as a bar graph (see below).
The bar chart generated from the selected drug pair represents the efficacy of the drug combination
when tested against NCI's standard set of 60 cancer cell lines.
Generally, a higher score value indicates the drug combination slowed the growth of a particular type of
cancer more effectively than what would be expected, based on the performance of the drugs when tested separately.
The drug almanac data are queryable in the Query Drug Data (https://discover.nci.nih.gov/cellminer/drugQuery.do).
The drug almanac data can be downloaded in total at the Download Data Sets under "DTP Almanac Combo Score" (https://discover.nci.nih.gov/cellminer/loadDownload.do).
A brief platform description is available in Data Set Metadata under "NCI Almanac Data: Combo Scores" (https://discover.nci.nih.gov/cellminer/datasets.do).
Drug almanac study results are originally from the Developmental Therapeutics Program (DTP) (https://dtp.cancer.gov/ncialmanac/initializePage.do).
|
Table 1: Drug almanac combo scores |
|
| BR:MCF7 |
-57 |
| BR:MDA-MB-231 |
19 |
| BR:HS 578T |
8 |
| BR:BT-549 |
-33 |
| BR:T-47D |
-89 |
| CNS:SF-268 |
-69 |
| CNS:SF-295 |
-71 |
| CNS:SF-539 |
-15 |
| CNS:SNB-19 |
-23 |
| CNS:SNB-75 |
-28 |
| CNS:U251 |
-21 |
| CO:COLO 205 |
-62 |
| CO:HCC-2998 |
-20 |
| CO:HCT-116 |
-57 |
| CO:HCT-15 |
-43 |
| CO:HT29 |
-29 |
| CO:KM12 |
-157 |
| CO:SW-620 |
-59 |
| LE:CCRF-CEM |
-55 |
| LE:HL-60(TB) |
-41 |
| LE:K-562 |
-60 |
| LE:MOLT-4 |
-8 |
| LE:RPMI-8226 |
-65 |
| LE:SR |
109 |
| ME:LOX IMVI |
-65 |
| ME:MALME-3M |
-54 |
| ME:M14 |
-60 |
| ME:SK-MEL-2 |
-78 |
| ME:SK-MEL-28 |
-76 |
| ME:SK-MEL-5 |
23 |
| ME:UACC-257 |
-31 |
| ME:UACC-62 |
-97 |
| ME:MDA-MB-435 |
-114 |
| ME:MDA-N |
- |
| LC:A549/ATCC |
-31 |
| LC:EKVX |
-211 |
| LC:HOP-62 |
-46 |
| LC:HOP-92 |
-35 |
| LC:NCI-H226 |
-15 |
| LC:NCI-H23 |
-59 |
| LC:NCI-H322M |
-102 |
| LC:NCI-H460 |
-48 |
| LC:NCI-H522 |
-79 |
| OV:IGROV1 |
-43 |
| OV:OVCAR-3 |
-7 |
| OV:OVCAR-4 |
-82 |
| OV:OVCAR-5 |
-30 |
| OV:OVCAR-8 |
-34 |
| OV:SK-OV-3 |
-52 |
| OV:NCI/ADR-RES |
-65 |
| PR:PC-3 |
-44 |
| PR:DU-145 |
-71 |
| RE:786-0 |
-80 |
| RE:A498 |
2 |
| RE:ACHN |
-16 |
| RE:CAKI-1 |
-64 |
| RE:RXF 393 |
-19 |
| RE:SN12C |
-35 |
| RE:TK-10 |
-47 |
| RE:UO-31 |
-22 |
|
| |
| |
|
|
|