|
|
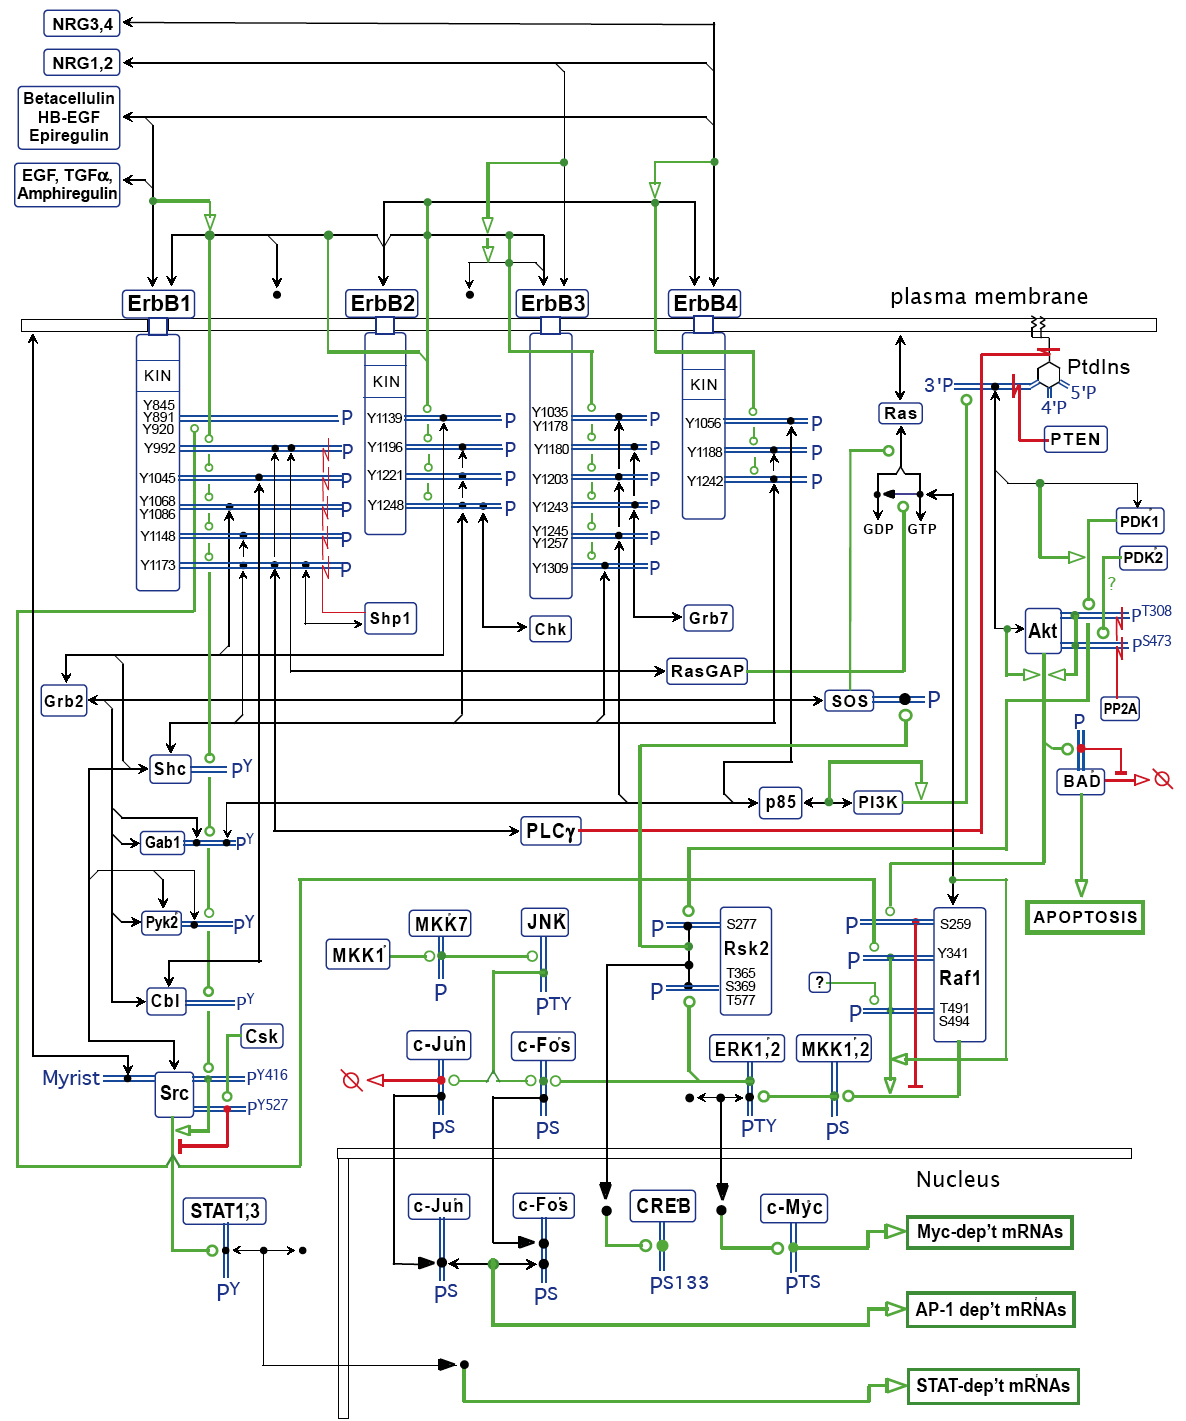
EGFR
Molecular Interaction Map (MIM) of signaling from epidermal growth factor (EGF) receptors
The best way to view the map is with on a PC with Firefox or Chrome and on a MAC with Safari or Chrome.
Kurt W. Kohn, Mirit I. Aladjem, Sohyoung Kim, John N. Weinstein and Yves Pommier
Implemented by : Margot Sunshine, Mirit I. Aladjem and David Kane
Heuristic MIM of part of the network of signaling from EGF receptors that is presented in process diagram notation in
Figure 1 of Oda et al. Molec. Systems Biol. 10.1038 2005. This MIM displays an integral core of the network (Kohn
et al. Molec. Systems Biol. 2006, 2:51). It compares the MIM notation with the Process Diagram notation of H.
Kitano et al, and shows in particular how interactions of multiple receptor family members can be denoted.
|