
MIMMiner
A Molecular Interaction Map (MIM) is a diagram convention that is capable of unambiguous representation of networks containing multi-protein complexes, protein modifications, and enzymes that are substrates of other enzymes. This graphical representation makes it possible to view all of the many interactions in which a given molecule may be involved, and it can portray competing interactions, which are common in bioregulatory networks. In order to facilitate linkage to databases, each molecular species is represented only once in a diagram. A formal description of the MIM notation can be found in Kohn et al., Molecular Biology of the cell 17, 1-13 2006. The updated formal specification for software implementation can be found in Luna et al., BMC Bioinformatics 2011, 12:167.
MIM Diagrams
Interactive electronic molecular interaction maps (eMIMs) allow the user to navigate through the molecular interaction network and link to molecular databases, references and annotations that contain pertinent information. Molecular species can be located on the map by means of indexed grid coordinates and on eMIMs through interactive links. Each interaction is referenced to an annotation list where pertinent information and references can be found.eMIMs (interactive)
Older maps may use variant sets of symbols as described in the publications associated with each map.
- AKT - AKT regulation by phosphorylation/dephosphorylation reactions.
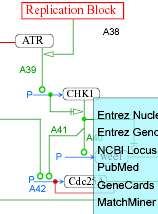
- Chk2 - cellular response to DNA double-strand breaks (DSB).
- Chk2 (updated) - cellular response to DNA double-strand breaks (DSB).
- EGFR - heuristic MIM of signaling from EGF receptors.
- Histone - chromatin assembly during replication.
- Hypoxia - transcriptional activation in response to low oxygen levels.
- p53 and Mdm2 - regulatory response to DNA damage.
- p53-MdmX-Mdm2 - network model
- Replication (updated) - cell cycle regulation of the early stages of DNA synthesis.
- Replicative Senescence - senescence regulation by cell cycle checkpoints and the epithelial-mesonchymal transition.
- SIRT1/PARP1 crosstalk - connecting DNA damage and metabolism.
MIM Software
There are several ongoing software projects to simplify creating and editing MIM diagrams and related metadata. Some of the software components provided allow developers to speed up the development of MIM support, allow for interoperable tools, and to provide a means of mining the data contained in MIM diagrams for other uses.Documentation
- MIM Specification - Documentation on how to read and understand MIM diagrams. Note: eMIMs users refer to this description.
- MIMML XML Schema - An XML Schema for the machine-readable format for MIM diagrams supporting the visual layout of MIM diagrams. Example datasets.
Tools
- MIM API - A Java-based API that binds MIMML elements to Java objects and provides JavaBeans-style methods such as "getFoo()" and "setFoo()", thereby providing a mechanism for parsing, creating, and manipulating MIMML documents. Additional documentation is provided here.
- MIM Plugin for Pathvisio - Pathvisio plugin which adds the ability to draw all the MIM glyphs, and to annotate diagram elements with comments, literature references, and links to external databases; outputs to PDF, PNG, GPML, and MIMML. Available for Windows, OS X, and Linux using platform-independent Java.
- MIMTool - MIM drawing tool that outputs SBML, MIMML and PDF files. It possesses a novel semi-automatic orthogonal drawing engine to minimize bends and crossovers when drawing interactions. Available for Windows and Linux.
- PathVisio-Validator - For use with PathVisio-MIM, this plugin assists in the creation of pathway diagrams by ensuring correct usage of the MIM notation, and thereby reducing ambiguity when diagrams are shared amongst biologists.
Systems Biology Graphical Notation
The MIM notation was the basis for the development of the entity-relationship component (SBGN-ER) of the Systems Biology Graphical Notations (SBGN). SBGN is an international effort to standardize diagrams depicting biochemical and cellular processes studied in systems biology, including several notations designed for different purposes.An animated description of the steps leading to src activation by EGFR is available (pdf).