GBG logo Molecular Interaction Maps LMP, CCR, NCI, NIH
Genomics and Bioinformatics Group Home
MIM home
STKE Paper
Map Symbols
Map Navigation
Credits
EGFR
Map description Interactive Map Image

Molecular Interaction Map (MIM) of signaling from epidermal growth factor (EGF) receptors
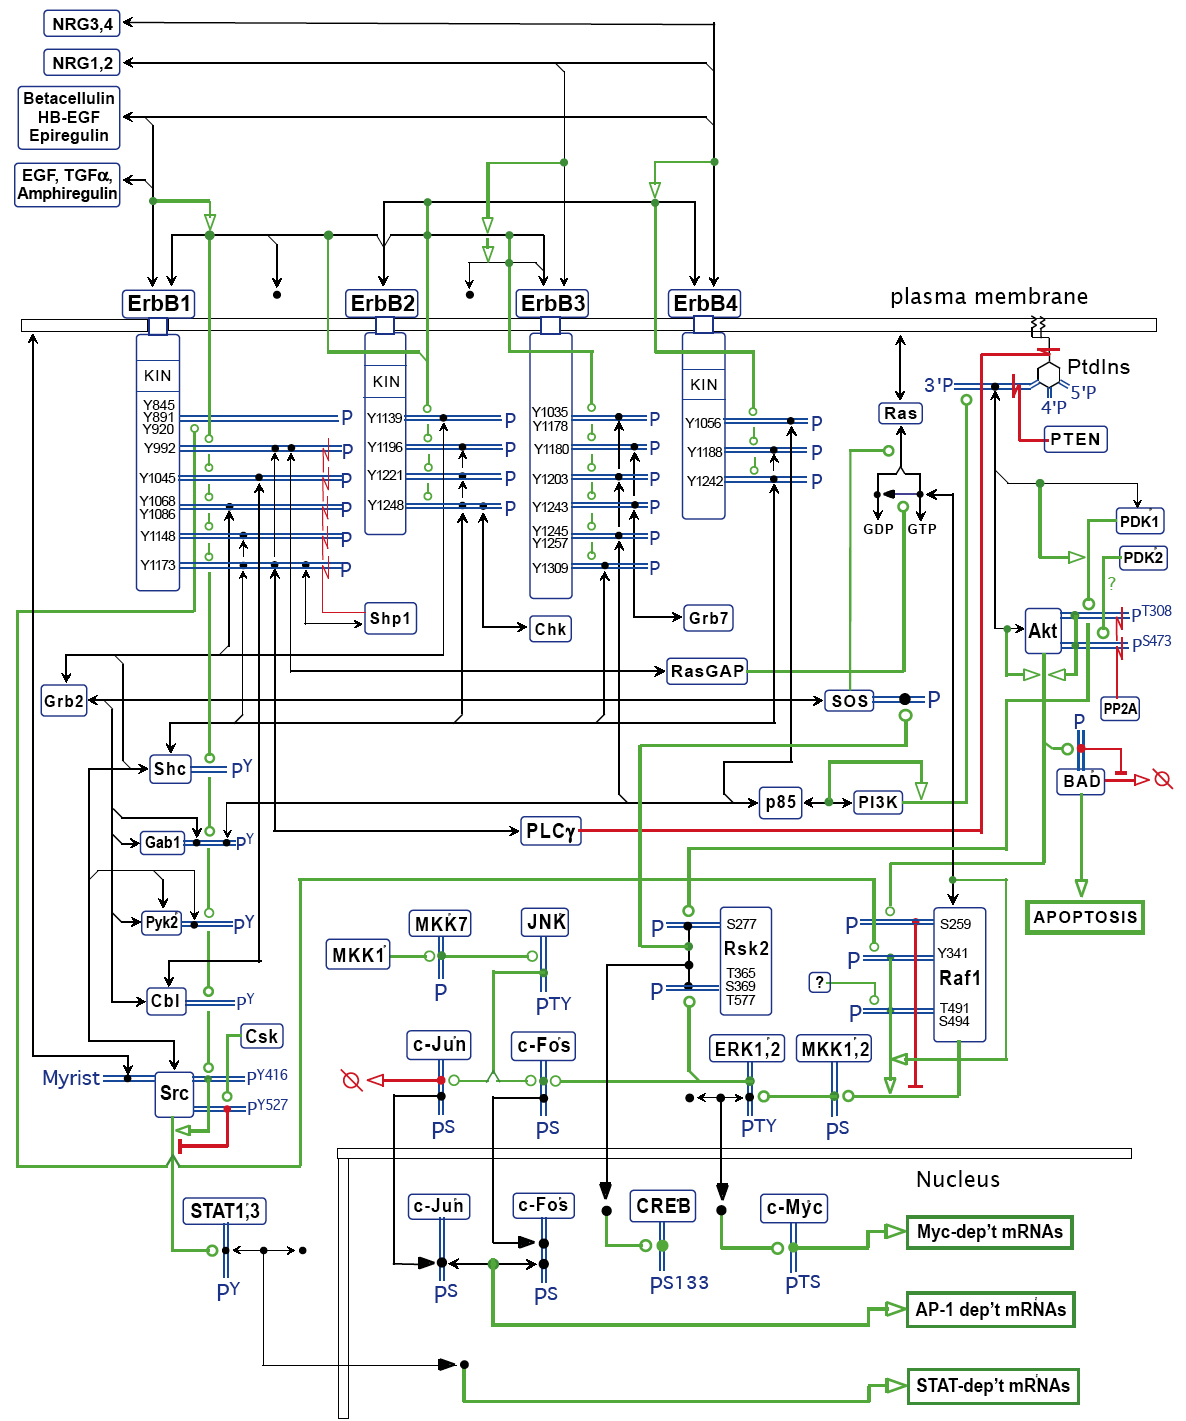
MIM of EGF receptors
Kurt W. Kohn, Mirit I. Aladjem, Sohyoung Kim, John N. Weinstein and Yves Pommier

Implemented by : Margot Sunshine, Mirit I. Aladjem and David Kane

Heuristic MIM of part of the network of signaling from EGF receptors that is presented in process diagram notation in Figure 1 of Oda et al. Molec. Systems Biol. 10.1038 2005. This MIM displays an integral core of the network (Kohn et al. Molec. Systems Biol. 2006, 2:51). It compares the MIM notation with the Process Diagram notation of H. Kitano et al, and shows in particular how interactions of multiple receptor family members can be denoted.

Map symbols       Map Navigation

This website is a development of the Genomics and Pharmacology Facility, Developmental Therapeutics Branch (DTB), Center for Cancer Research (CCR), National Cancer Institute (NCI).

If you have questions or comments about this site, please send them to: webadmin@discover.nci.nih.gov.

Genomics and Pharmacology Facility
                Home Page Link to Center for Cancer Research Home Page Link to National Cancer Institute Home Page Link to National Institutes of Health Link to Department of Health & Human Services Home Page