The best way to view the map is with on a PC with Firefox or Chrome and on a MAC with Safari or Chrome. 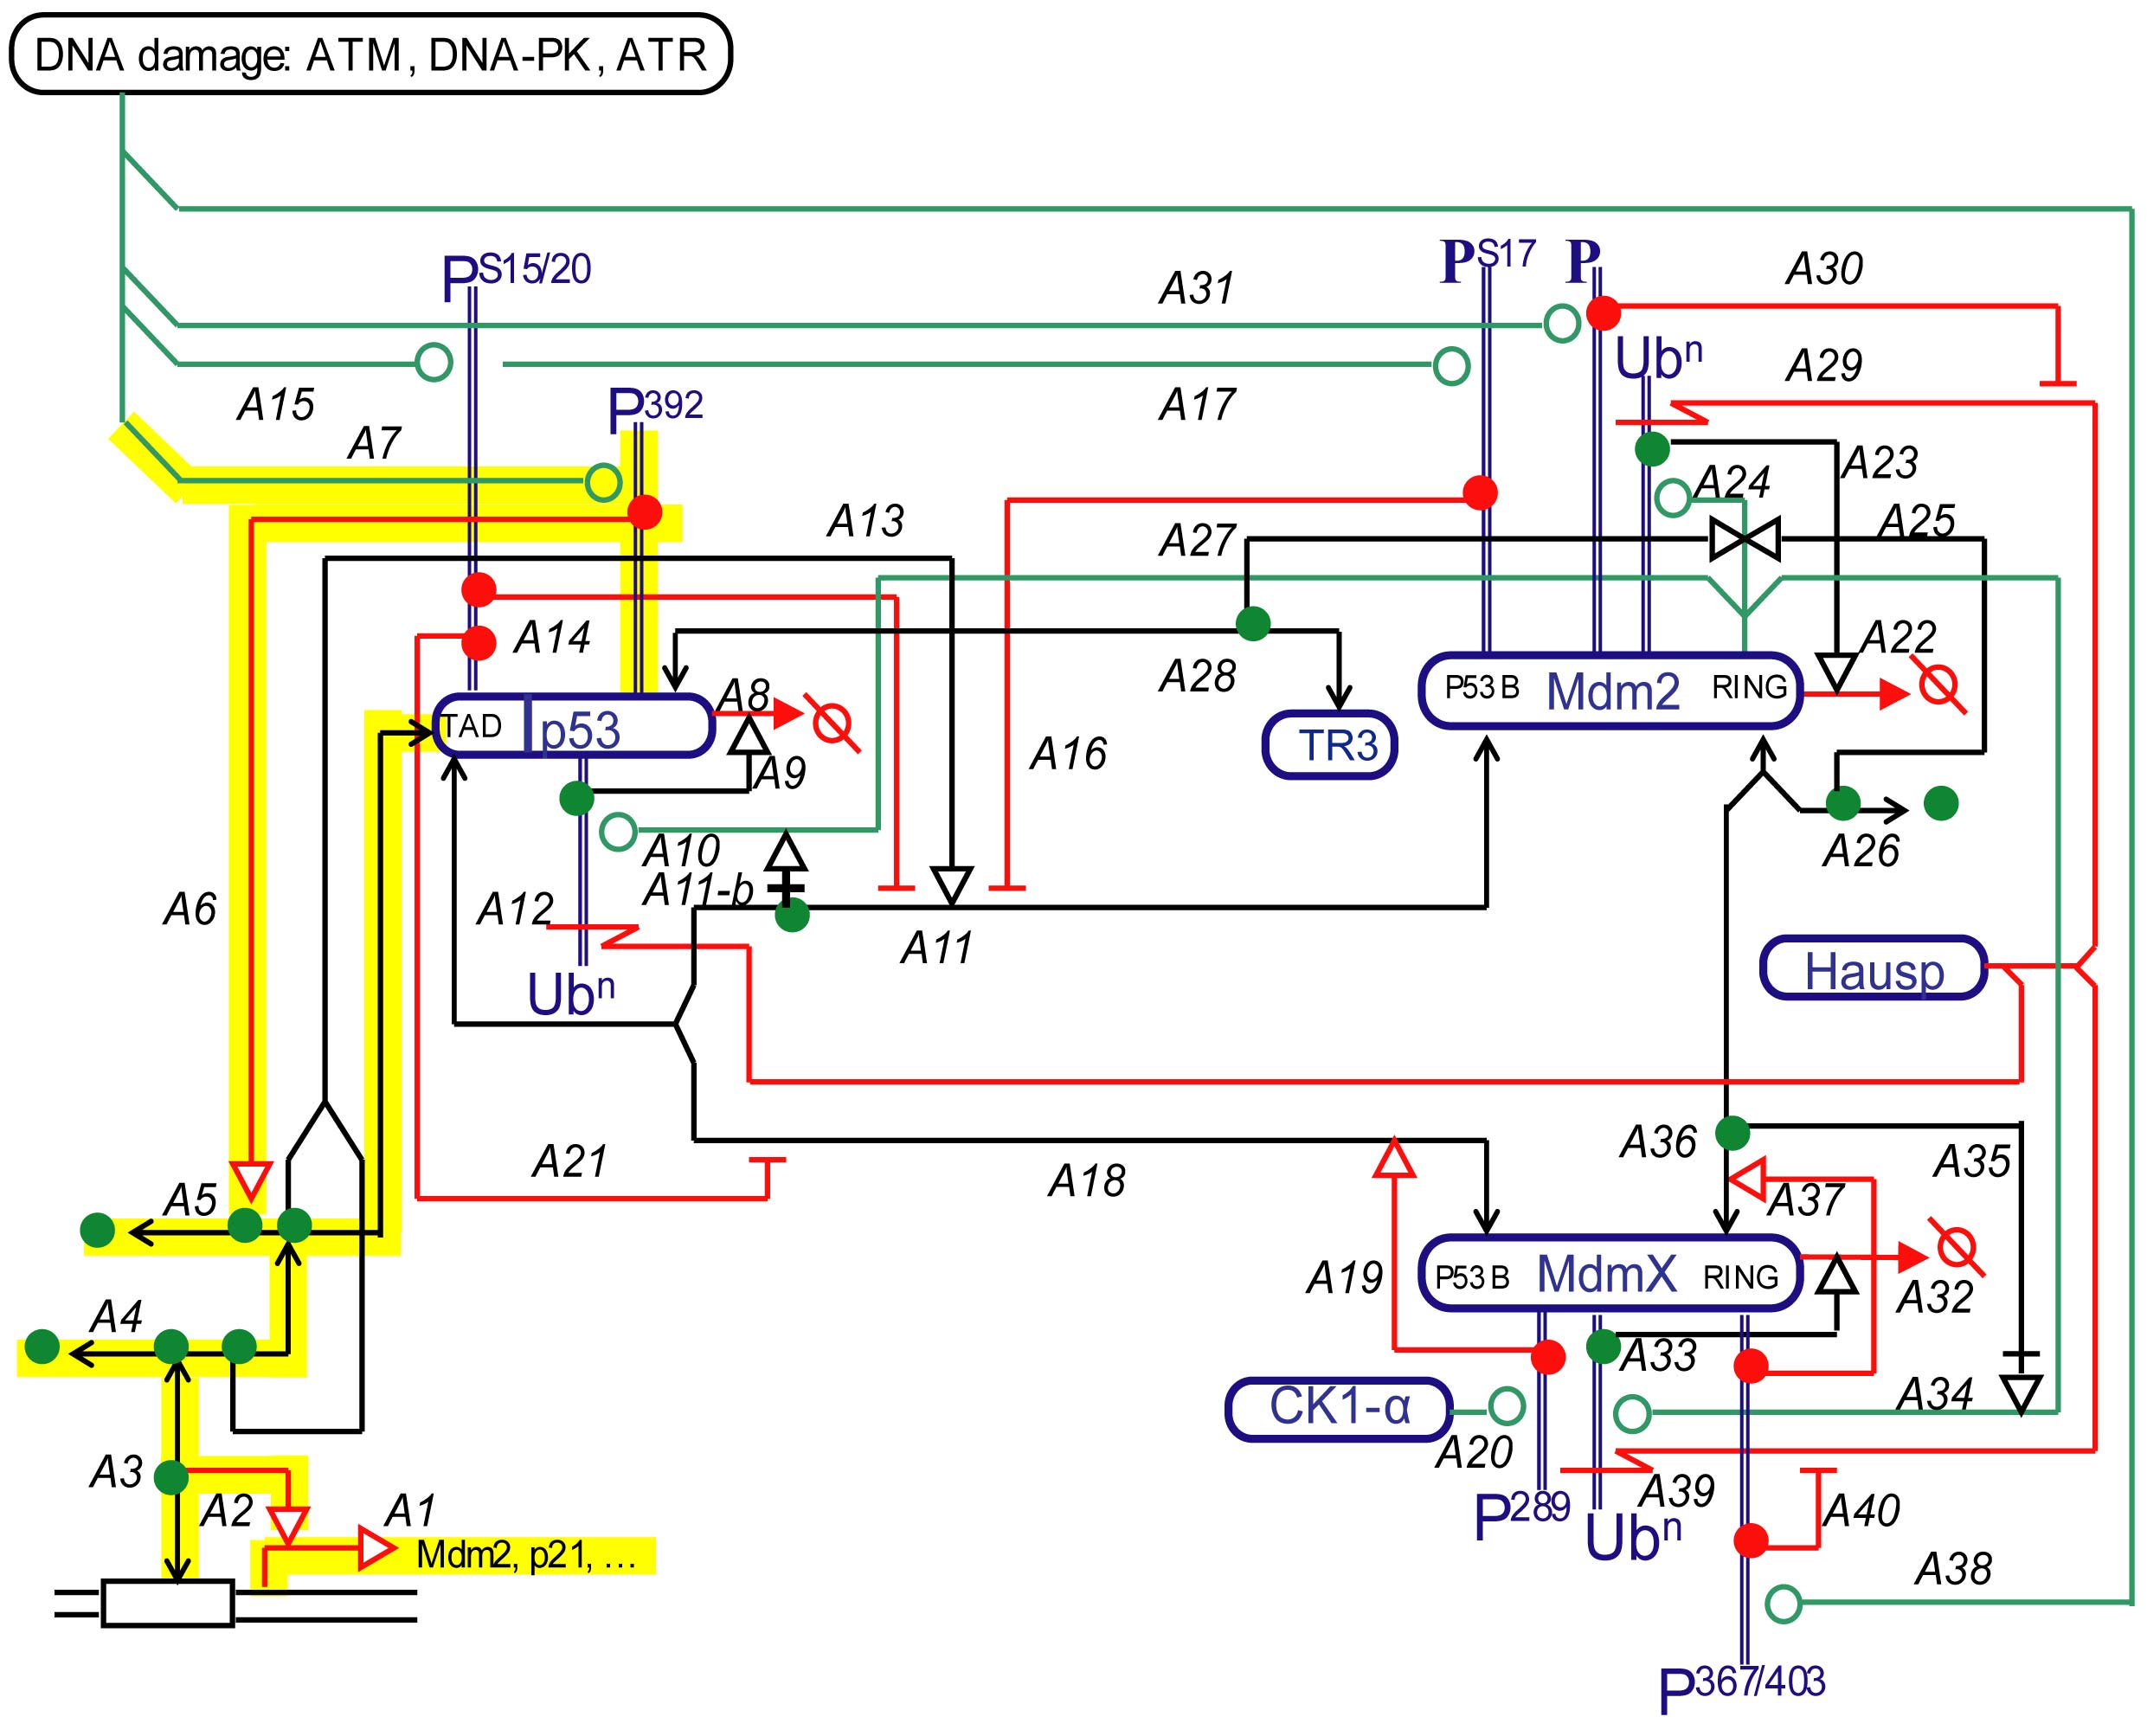
Sohyoung Kim, Mirit I. Aladjem, Geoffrey B. McFadden, Kurt W. KohnImplemented by : Margot Sunshine To read the original paper describing this map and the symbols used, click here.To lay the foundation of a model, we first assembled the known molecular interactions among p53, Mdm2, and MdmX in the form of a heuristic MIM (Figure 1) using the previously described notation (Kohn, 1999, 2001; Kohn et al., 2006). The heuristic MIM organizes information from which explicit models (Figure 2) for simulations can be extracted and portrayed as an explicit MIM (Kohn 2001). Map symbols Map Navigation |
|
This website is a development of the Genomics and Pharmacology Facility, Developmental Therapeutics Branch (DTB), Center for Cancer Research (CCR), National Cancer Institute (NCI). |
|
If you have questions or comments about this site, please send them to: webadmin@discover.nci.nih.gov. |
|
|
|
|
|
|