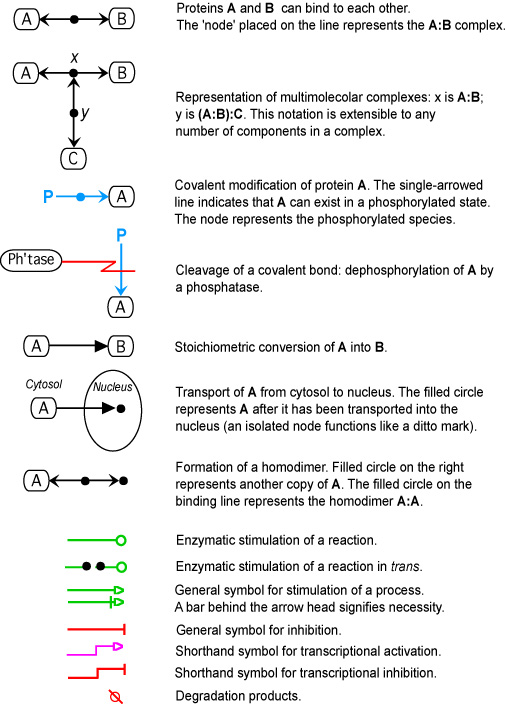
GBG logo Molecular Interaction Maps LMP, CCR, NCI, NIH
Genomics and Bioinformatics Group Home
MIM home
STKE Paper
Map Symbols
Map Navigation
Credits
p53 Mdm2 Map
Map description Static Map Image

Molecular interaction map of the p53 and Mdm2 logic elements, which control the Off-On switch of p53 in response to DNA damage

The best way to view the map is with on a PC with Firefox or Chrome and on a MAC with Safari or Chrome.

Molecular interaction map of the p53 and Mdm2 logic elements

Date last update: Dec. 21, 2004

Kurt W. Kohn and Yves Pommier

Implemented by : Margot Sunshine, Hong Cao and David Kane

To read the original paper describing this map and the symbols used, click
here.

The molecular network that controls responses to genotoxic stress is centered at p53 and Mdm2. Recent findings have shown this network to be more complex than previously envisioned. Using a notation specifically designed for circuit diagram-like representations of bioregulatory networks, we have prepared an updated molecular interaction map of the immediate connections of p53 and Mdm2, which are described as logic elements of the network. We use the map as the basis for a comprehensive review of current concepts of signal processing by these logic elements.

Map symbols       Map Navigation

This website is a development of the Genomics and Pharmacology Facility, Developmental Therapeutics Branch (DTB), Center for Cancer Research (CCR), National Cancer Institute (NCI).

If you have questions or comments about this site, please send them to: webadmin@discover.nci.nih.gov.

Genomics and Pharmacology Facility
                Home Page Link to Center for Cancer Research Home Page Link to National Cancer Institute Home Page Link to National Institutes of Health Link to Department of Health & Human Services Home Page