GBG logo Molecular Interaction Maps LMP, CCR, NCI, NIH
Genomics and Bioinformatics Group Home
MIM home
STKE Paper
Map Symbols
Map Navigation
Credits
p53-MdmX-Mdm2
Map description Interactive Map Image
Molecular Interaction Map of the Mdm2 Degradation
Sohyoung Kim, Mirit I. Aladjem, Geoffrey B. McFadden, Kurt W. Kohn

Implemented by : Margot Sunshine

To read the original paper describing this map and the symbols used, click
here.

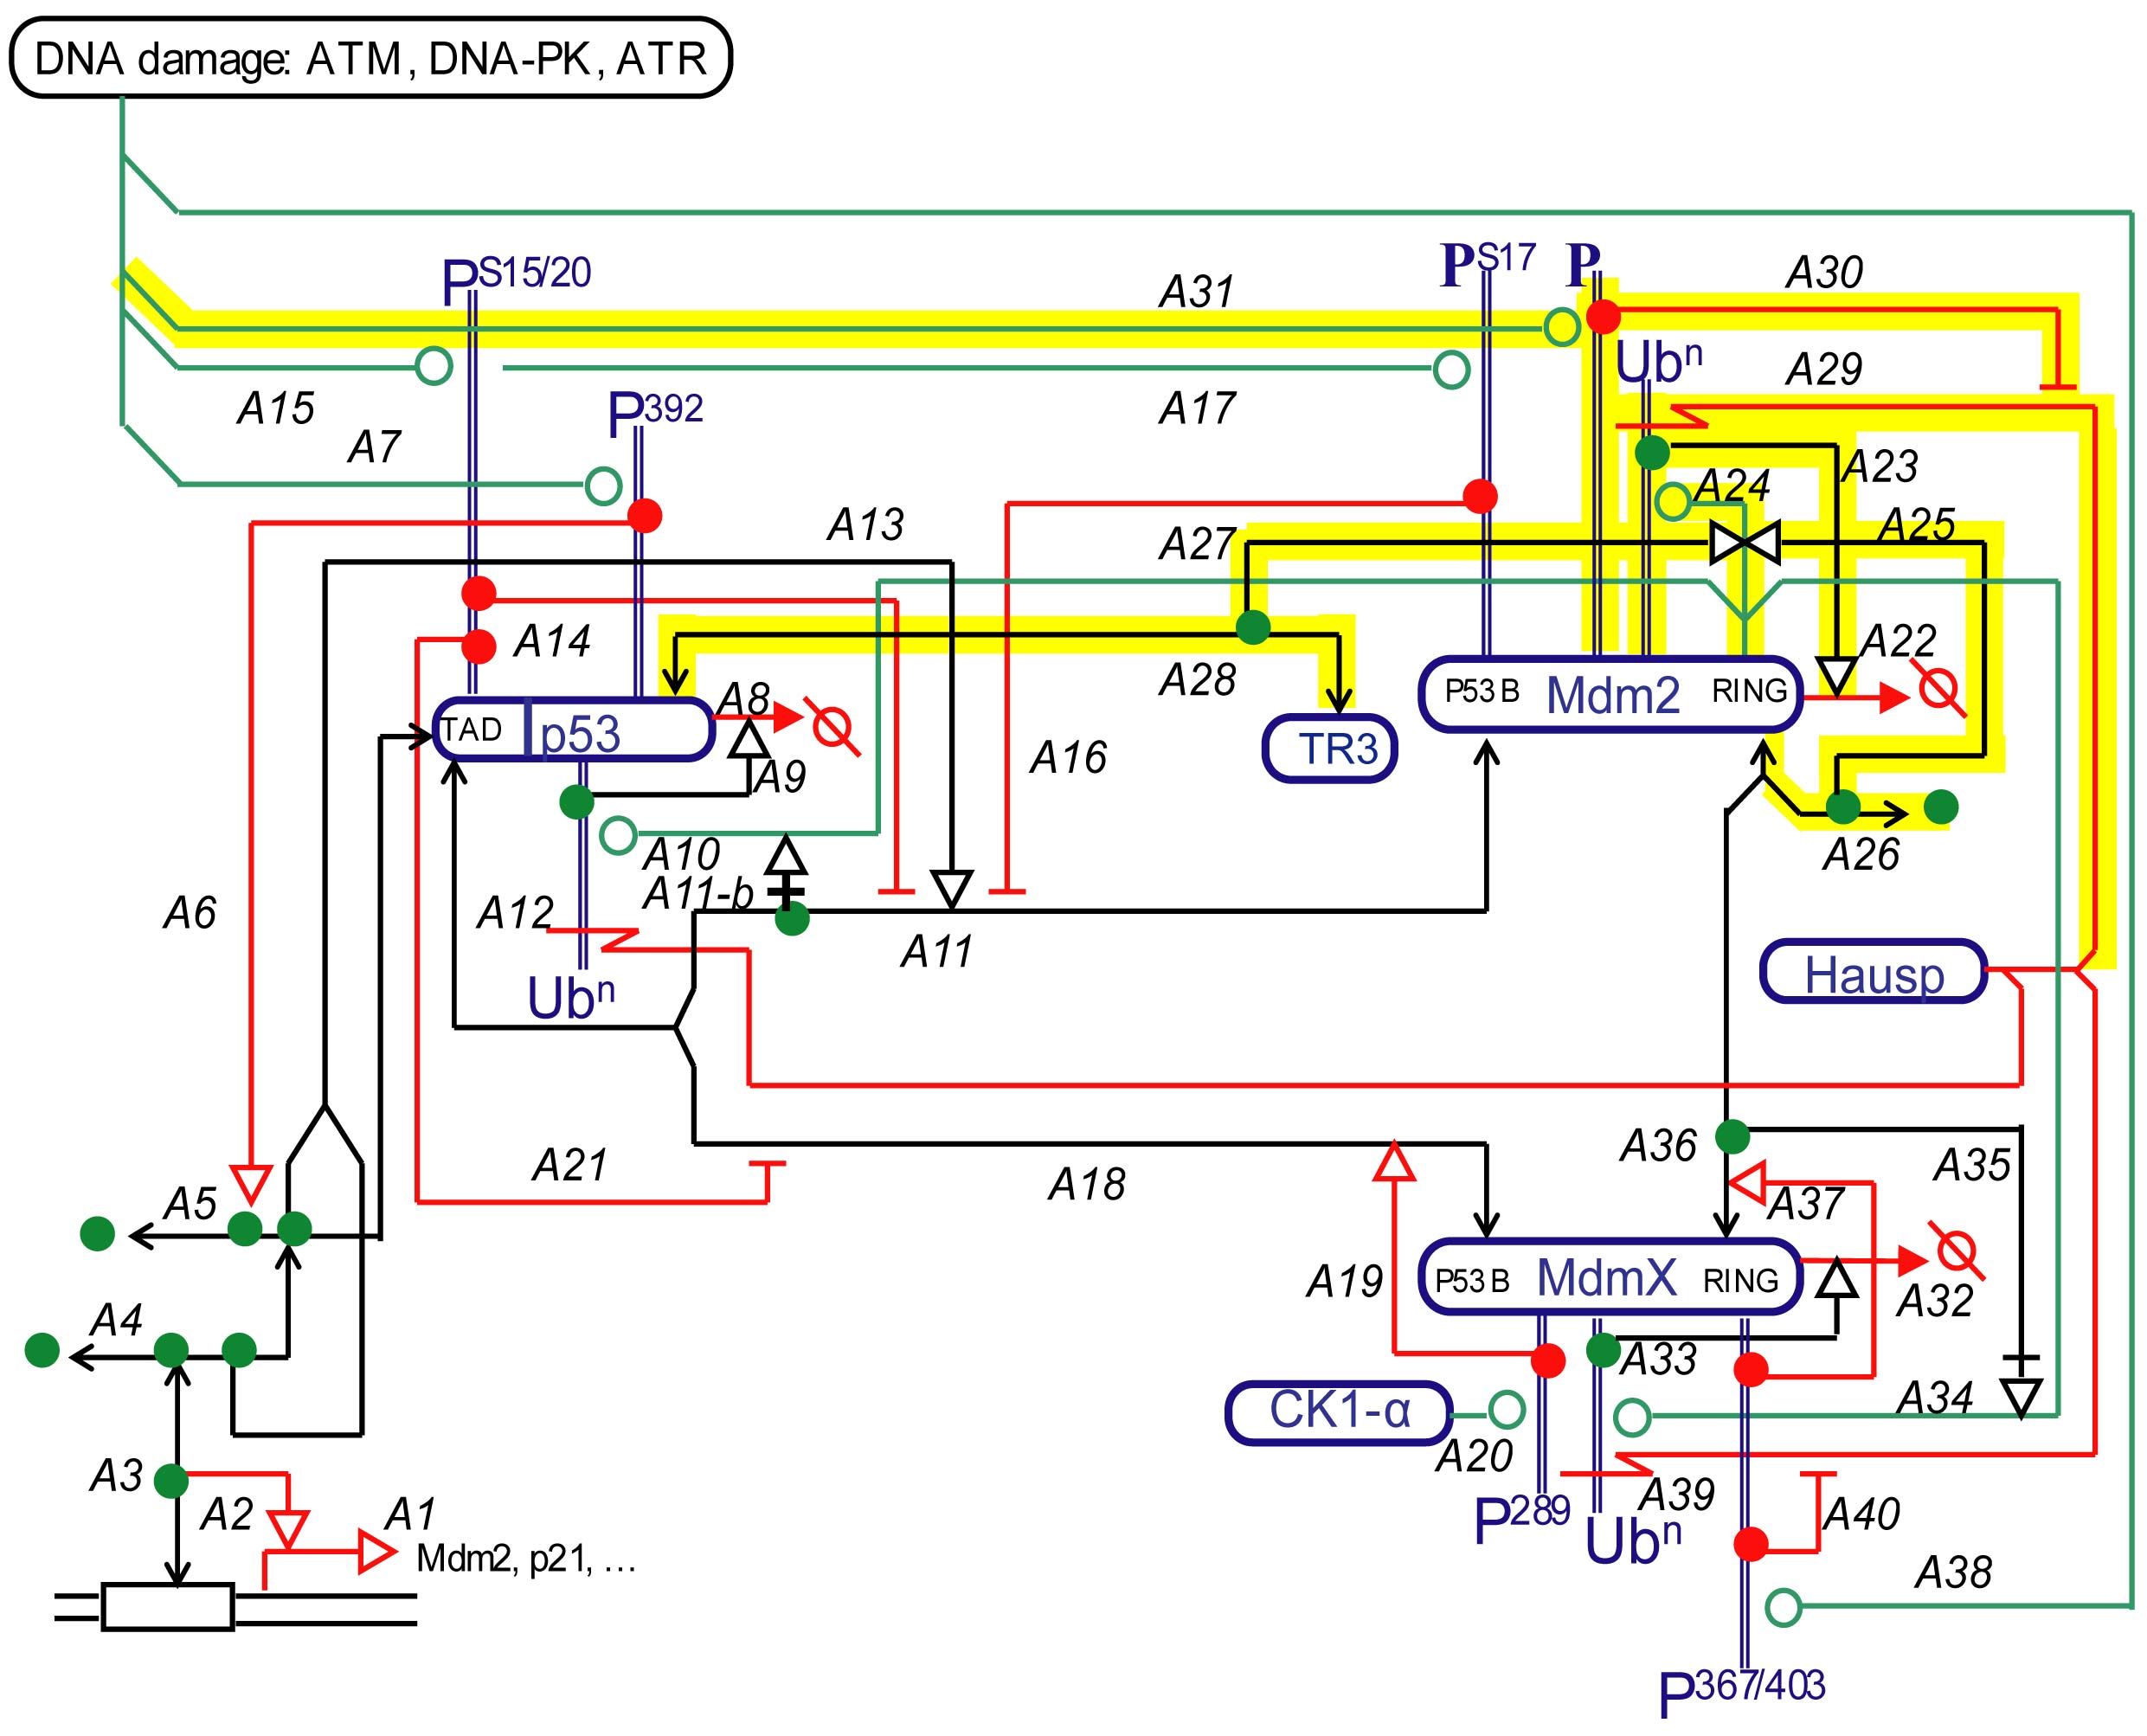
To lay the foundation of a model, we first assembled the known molecular interactions among p53, Mdm2, and MdmX in the form of a heuristic MIM (Figure 1) using the previously described notation (Kohn, 1999, 2001; Kohn et al., 2006). The heuristic MIM organizes information from which explicit models (Figure 2) for simulations can be extracted and portrayed as an explicit MIM (Kohn 2001).

Map symbols       Map Navigation

This website is a development of the Genomics and Pharmacology Facility, Developmental Therapeutics Branch (DTB), Center for Cancer Research (CCR), National Cancer Institute (NCI).

If you have questions or comments about this site, please send them to: webadmin@discover.nci.nih.gov.

Genomics and Pharmacology Facility
                Home Page Link to Center for Cancer Research Home Page Link to National Cancer Institute Home Page Link to National Institutes of Health Link to Department of Health & Human Services Home Page