
Official websites use .gov
A .gov website belongs to an official government organization in the United States.
Secure .gov websites use HTTPS
A lock () or https:// means you've safely connected to the .gov website. Share sensitive information only on official, secure websites.
CellMinerCDB
Table of Contents
- Introduction
- Univariate Analyses
- Multivariate Analysis
- Metadata
- Search IDs
- Navigation guide
- Contact/Feedback
- Data Sources
- About the Data
- About CellMinerCDB
- References
- Related links
Introduction
CellMinerCDB is an interactive web application that simplifies access and exploration of cancer cell line pharmacogenomic data across different sources (see Metadata section for more details). Navigation in the application is done using main menu tabs (see figure below). It includes 6 tabs: Univariate Analyses, Multivariate Analysis, Metadata, Search, Help and Video tutorial. Univariate Analyses is selected by default when entering the site. Each option includes a side bar menu (to choose input) and a user interface output to display results. Analysis options are available on the top for both the Univariant Analysis and Regression model tabs (see sub-menu on figure). The sub-menu first option result is displayed by default (Figure 1).
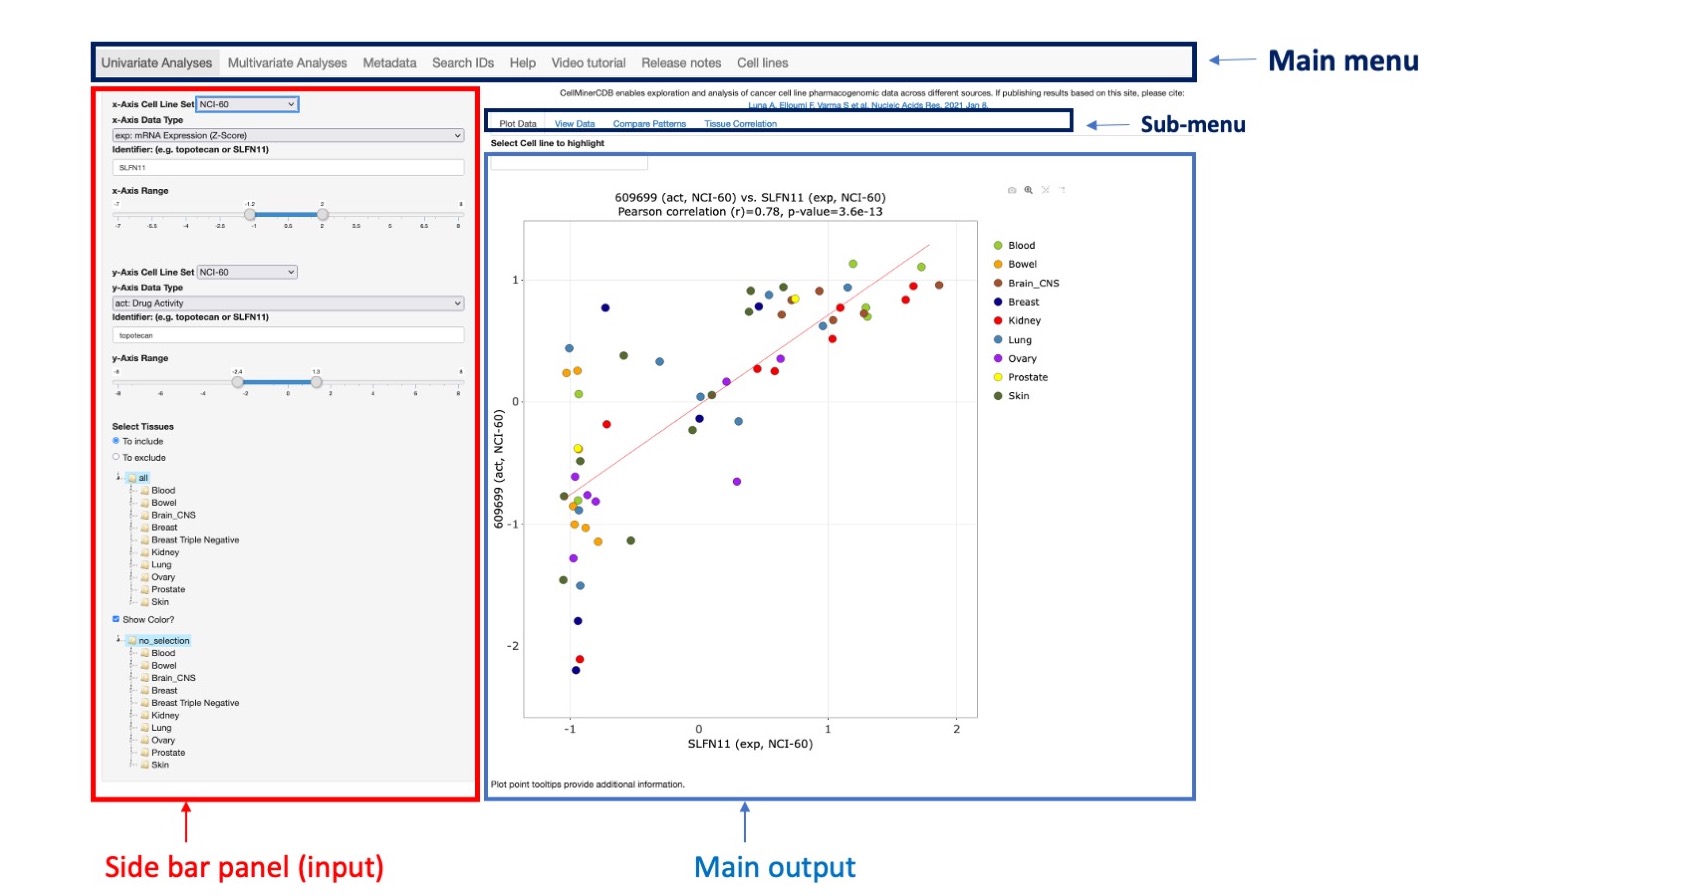
Figure 1: Main application interface
Univariate Analyses
Molecular and/or drug response patterns across sets of cell lines can be compared to look for possible association. The univariate analysis panel includes 4 options: Plot data, Download Data, Compare Patterns and Tissue Correlation. Almost all options have the same input data in the left side panel.
Input data
- The x-axis data choices includes 4 fields to be filled by the user:
- x-Axis Cell Line Set selects the data source. The user can choose: NCI60, CCLE, GDSC, CTRP or NCI/DTP SCLC (see Data Sources for more details).
- x-Axis Data Type selects the data type to query. The options for this vary dependent on the source selected above, and appear in the x-Axis Data Type dropdown. See the Metadata tab for descriptions and abbreviations.
- Identifier selects the identifier of interest for the above selected data type. For instance, if drug activity for the NCI-60 is selected, the user can enter a single drug name or drug ID (NSC number) or a paired drug ID (NSC1_NSC2). The Search IDs tab explores potential identifiers interactively, or to download datasets of interest.
- x-Axis Range allows the user to control the x-axis range for better visualization.
- The y-axis data choices are as explained above for the x-axis.
- Selected tissues: by default, all tissues are selected and included in the scatter plot. To include or exclude cell lines from specific tissues, the user should specify:
- Select Tissues to include or exclude specific tissues
- Select Tissues of Origin Subset/s functionality at the bottom of the left-hand panel. The tissues of Origin are organized as a tree and are all selected by default. In order to select a specific tissue, the user should click on the root of the tree represented by the triangle icon to expand the tree recursively until reaching a specific sub tree or leaf. The selection is finalized by clicking on the leaf label. On Macs, more than one tissue of origin may be selected using the “command” button. On PC's use the “control” key. All cell lines were mapped to the four-level OncoTree cancer tissue type hierarchy developed at Memorial Sloan-Kettering Cancer Center. In the CellminerCDB application, a tissue value is coded as an OncoTree node that can include elements from level 1 to level 4 separated by “:” character. For instance, the cell line MCF7 is a “breast” cell line but also more specifically it is a breast carcinoma. So MCF7 belong to different cancer tissue types (or hierarchical nodes) “breast” (level 1) and “breast: breast carcinoma (BRCA)” (level 2). There is no further sub-categorization for MCF7 however we can identify BT-549 cell line as “breast: breast carcinoma (BRCA): Breast Invasive Ductal Carcinoma (IDC)” (level 3).
- Tissues to Color to locate cell lines related to desired tissues within the scatter plot. By default, the cell lines are colored by their OncoTree cancer tissue level 1 pre-assigned color. Selecting a tissue makes related cell lines appear in red while remaining cell lines are colored in blue. The Show Color checkbox should be active.
Plot Data
Any pair of features from different sources across common cell lines can be plotted (as a scatterplot) including the resultant Pearson correlation and p-value. The p-value estimates assume multivariate normal data, and are less reliable as the data deviate from this. Please use the scatter plot to check the data distribution (e.g., for outlying points outside of a more elliptically concentrated set).
Some options are available to play with the plot image using icons on the top from left to right:
 | Downloads the plot as a png. |
 | Allows the user to zoom in on an area of interest by clicking and dragging with the pointer. |
 | Autoscales the image. |
 | Allows the user to create horizontal and vertical line from either a cell line dot or the regression line, by hovering over them. |
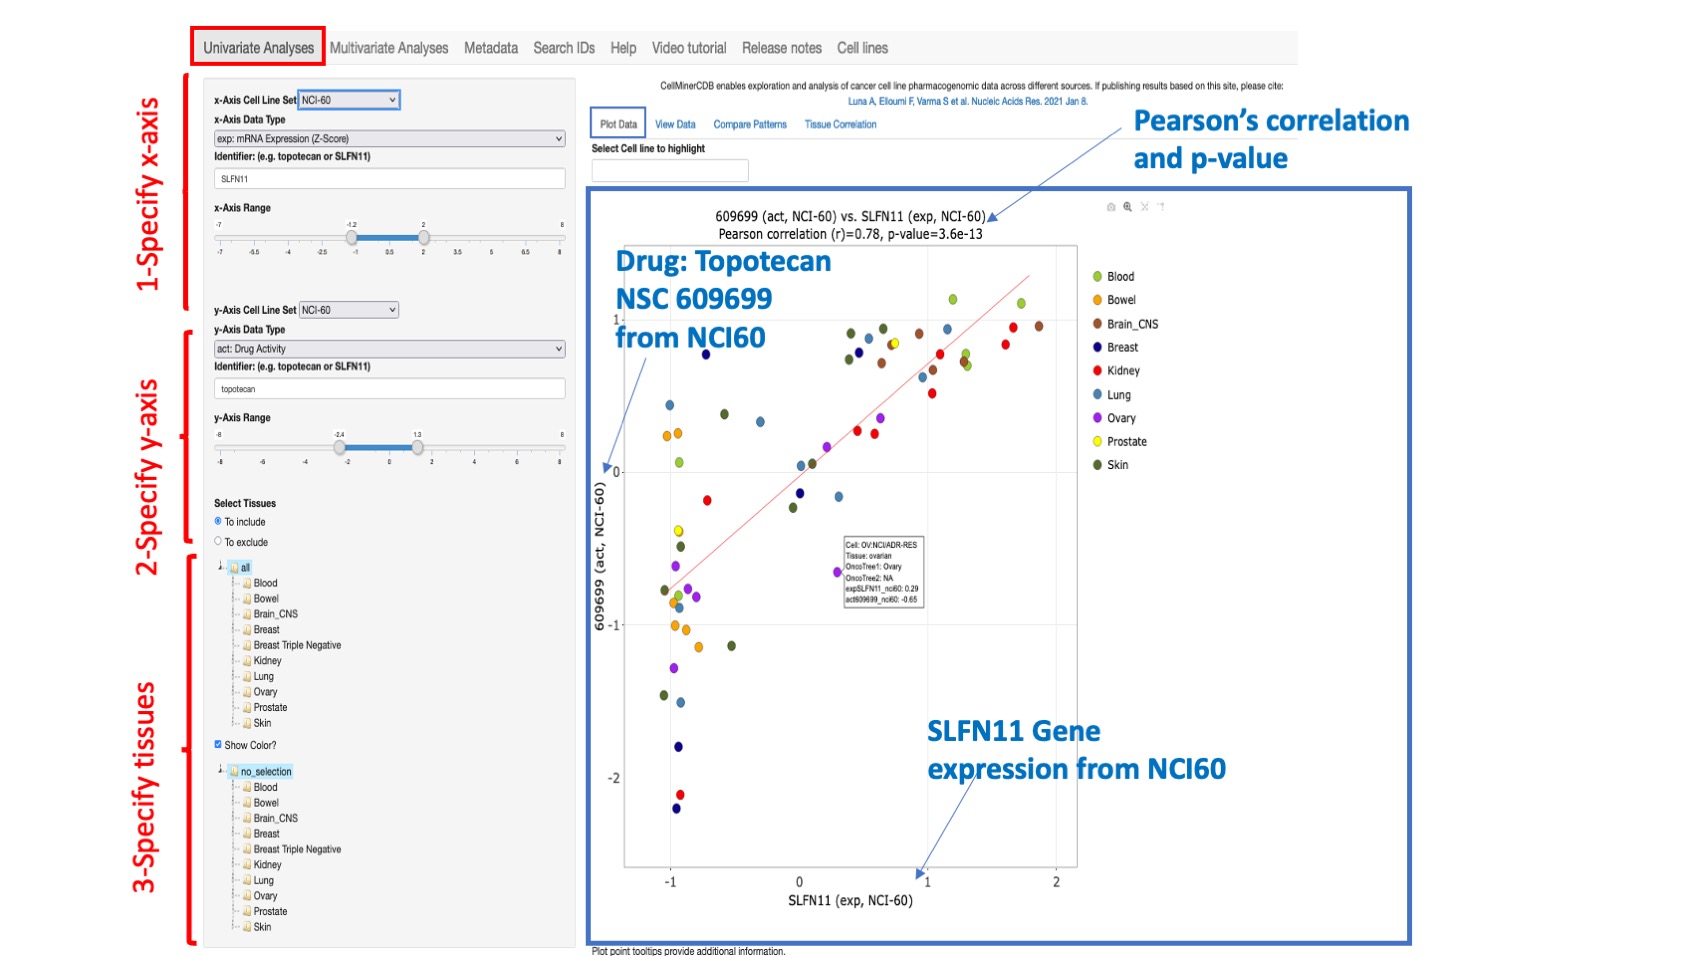
Figure 2: An example scatterplot of SLFN11 gene expression (x-axis) versus Topotecan drug activity (y-axis)/ both from the NCI60. Since Topotecan has 2 different drug ids in the NCI-60, the one with the lowest number of missing data is selected (here 609699). However, the user can type in their specific drug ID of interest. The Pearson correlation value and p value appear at the top of the plot. A linear fitting curve is included. This is an interactive plot and whenever the user changes any input value, the plot will be updated. Any point in the plot can be hovered over to provide additional information about cell line, tissue, Onco tree designation, and x and y coordinate values. On the top of the plot, you have the option to find and highlight your cell line within the plot.
View Data
This option both displays the data selected from the Plot Data tab in tabular form, and provides a Download selected x and y axis data as Tab-Delimited File option. The user can change the input data in the left selection panel as described for Plot Data. The displayed table include the cell line, the x-axis value, the y-axis value, the tissue of origin, the 4 onco-tree levels and other available cell line annotation such as Triple Negative Breast Cancer (TNBC) status. Within the header the selected features are prefixed by the data type abbreviation and post-fixed by the data source.
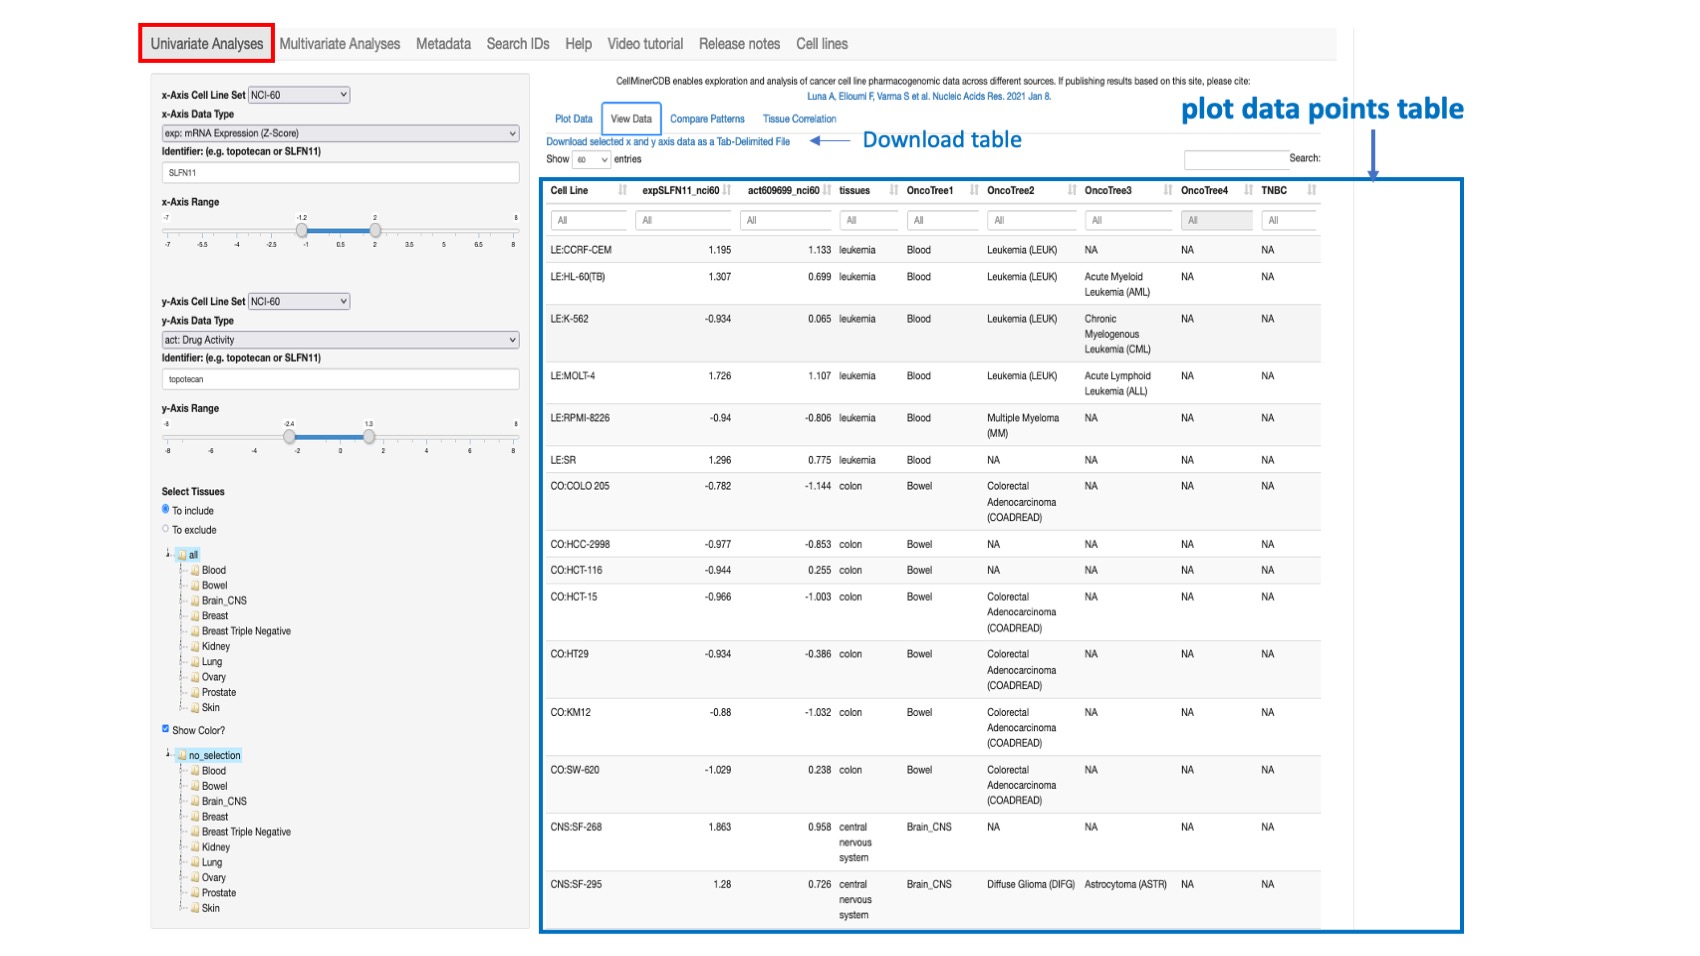
Figure 3: Shows the selected values for SLFN11 gene expression (x-axis) and Topotecan (id 609699) drug activity (y-axis) from the NCI-60 across all common lines. The features are coded as expSLFN11_nci60 and act609699_nci60 where “exp” and “act” represent respectively prefixes for gene expression based on z-score and drug activity.
Compare Patterns
This option allows one to compute the correlation between the selected feature as defined from the specified x- Axis Cell Line Set, x-Axix Data Type, and Identifier and either all drug or all molecular data from the (same) x-Axis or y-Axis source. By default all tissues are selected however the user can restrict the analysis to specific tissue of origin.
Pearson’s correlations are provided, with reported p-values (not adjusted for multiple comparisons) in tabular form. This displays features are organized by level of correlation, and includes target pathway for genes and mechanism of action (MOA) for drugs (if available).
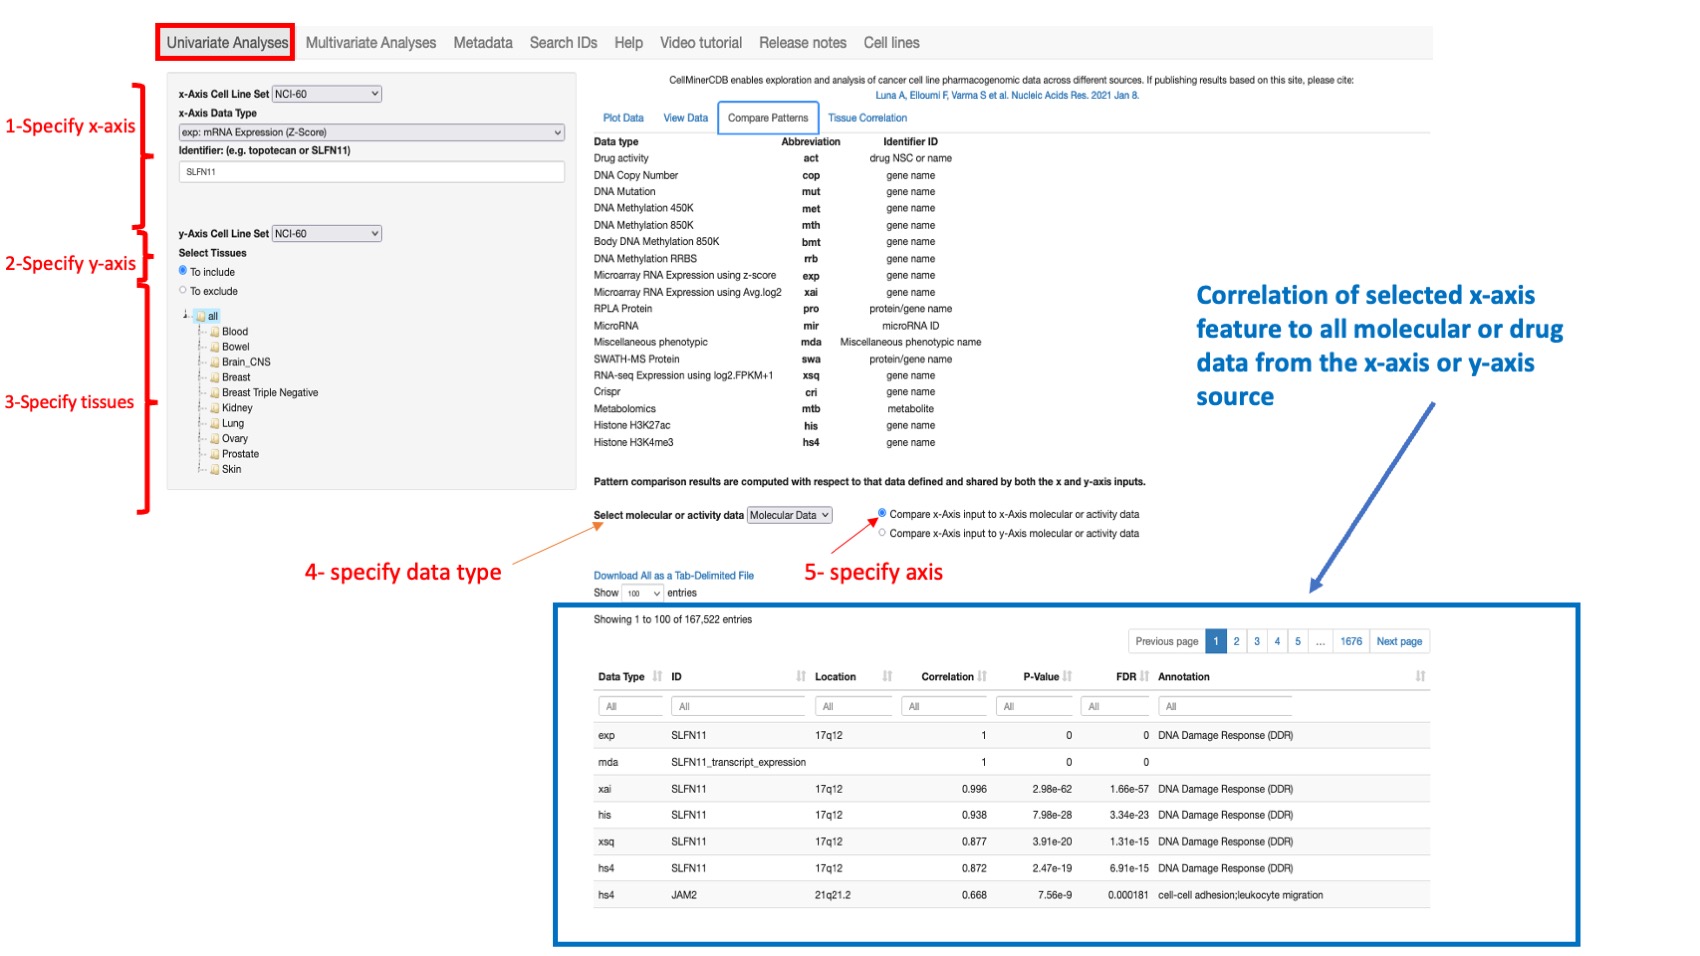
Figure 4: Shows correlation results for SLFN11 gene with all other molecular features for all NCI60 datasets sorted by correlation value with gene location and target pathways (annotation field).
Tissue Correlation
This option enables to display per tissue of origin (oncotype level 1) the number of cell lines with complete observations (non missing values), the correlation between the selected paired features and its p-value.
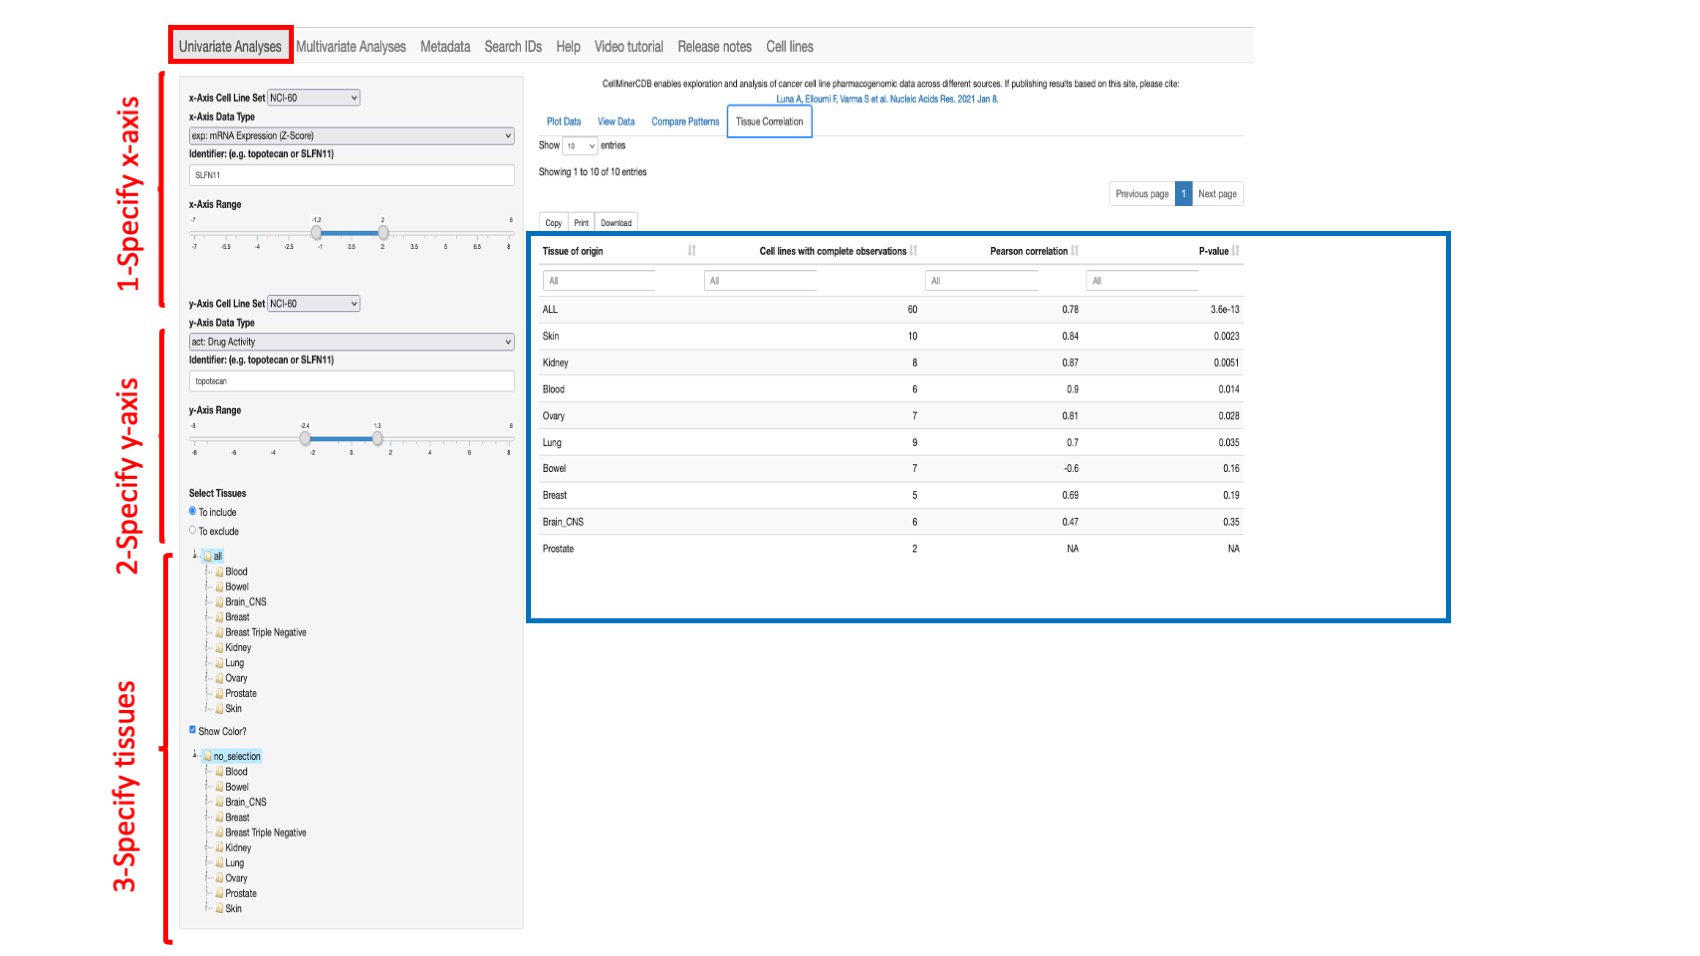
Figure 5: Shows the correlation between the selected values for SLFN11 gene expression (x-axis) and Topotecan (id 609699) drug activity (y-axis) from the NCI-60 across all common lines by tissue of origin. Note: The value “ALL” means all available common tissues between the 2 selected features.
Multivariate Analysis
The ‘Multivariate Analysis’ option (or module) has multiple tabs including Heatmap, Data, Plot, Cross-Validation, Tehnical Details and Partial Correlation (described below), and allows construction and assessment of multivariate linear response prediction models within a single cell line set. For instance, we can assess prediction of a drug activity based on some genes expression. To construct a regression model, you first need to specify the input data in the left side panel.
Input data
- The response variable is chosen by selecting:
- Response Cell Line Set selects the data source for the response varaiable. The user can choose: NCI60, CCLE, GDSC, CTRP or NCI/DTP SCLC or NCI-60/DTP Almanac (see the Data Sources section of Help for more details on these Cell Line Sets).
- Response Data Type selects the data type for the response variable (example: a drug or a molecular dataset). The options for this vary dependent on the source selected above, and appear in the Response Data Type dropdown. See the Metadata tab for data types description.
- Response Identifier selects the identifier for the response variable (e.g., a specific drug or gene identifier)
- The predictor variables are chosen by selecting:
- Predictor Cell Line Set selects the data source for the predictor variable. The user can choose: NCI60, CCLE, GDSC, CTRP or NCI/DTP SCLC or NCI-60/DTP Almanac.
- Predictor Data Type/s selects the data types(s) for the predictors variables. Use command button on Macs or control key on PCs to select more than one dataset.
- Minimal Predictor Range provides a required minimum value for the identifier to be included for the first listed data type. The default is 0. One may increase this value to eliminate predictors that are considered to have insufficient range to be biologically meaningful.
- Predictor Identifiers selects the identifiers for the predictors.When using the Linear Regression algorithm, predictors are required to be enter. In figure 5, we explore linear model prediction of Topotecan drug activity in the NCI-60 choosing SLFN11 and BTPF gene expression. Identifiers from different sources may be combined using 2 methods. In the first, select multiple Data Types as desired, and enter your identifiers. The model will be built automatically using those Data Types and Identifiers. For example, if expression and mutation are selected as Data Types and SLFN11 and BPTF are entered as identifiers, the model will be built using 4 identifiers: expSLFN11, expBTPF, mutSLFN11 and mutBTPF. In the second, more specific approach, you enter the identifier with the data type prefix. For example, if your predictor variables are specifically the expression value for SLFN11 and mutation value for BTPF then you can enter as identifiers: expSLFN11 and mutBTPF. When using the Lasso algorithm, predictors are optional for the Lasso algorithm (see point 4) since it identifies automatically the ones that best fit the Lasso model.
- Select Tissue/s of Origin is used to include or exclude specific tissues, as defined in the next step. By default, all tissue types are included, howver you can select one or any multiple of tissue types (to include or exclude). Use the radio buttons To include or To exclude to select specific tissues to include or exclude. To make selections on Macs, use the “command” key. To make selections on PC's use the “control” key
- Algorithm: by default, the Linear Regression model is selected however you can also select the Lasso model (penalized linear regression model) machine learning approach. Linear regression is a linear approach to modeling the relationship between a response (or dependent variable) and one or more predictor variables (or independent variables). It is implemented using the R stats package lm() function. 10-fold cross validation is applied to fit model coefficients and predict response, while withholding portions of the data to better estimate robustness. Lasso is Least absolute selection and shrinkage operator, a penalized linear regression model. Lasso is implemented using the cv.glmnet function (R package glmnet). Lasso performs both variable selection and linear model coefficient fitting. The lasso lambda parameter controls the tradeoff between model fit and variable set size. Lambda is set to the value giving the minimum error with 10-fold cross-validation. The lasso lambda parameter controls the tradeoff between model fit and variable set size. The Lambda is set to the value giving the minimum error with 10-fold cross-validation. Set.seed, the initial seed is set to 1. Alpha is set to one. The minimum lambda is used to select the intercept and the coefficient for the variable (there is no range). 10-fold cross validation is applied to fit model coefficients and predict response, while withholding portions of the data to better estimate robustness. For further details on either of these outputs, see the respective R packages. If Lasso algorithm is selected, you have to specify:
- Select Gene Sets: The gene selection is based on curated gene sets such as DNA Damage Repair DDR or Apoptosis. The user can select one or more gene sets.
- Maximum Number of Predictors allows choice of the number of predictors (default 4)
Once all the above information is entered, a regression model is built and the results are shown in different ways such as the technical details of the model, observed vs. predictive responses plots or variables heatmap. Find below an explanation of different output for the regression model module.
Heatmap
This option provides the observed response and predictor variables across all source cell lines as an interactive heatmap. For the heatmap visualization, data are range standardized (subtract the minimum, and divide by the range) to values between 0 and 1, based on the value range within all rows of a given data type (by default) or within each row of data (if ‘Use Row Color Scale’ is selected). For data types other than mutation data, the range is trimmed to the difference between the 95th and 5th percentiles; values below or above the 5th and 95th percentile values are scaled to 0 and 1, respectively. In the case of mutation data, the range used for scaling is the difference between the maximum and minimum values. If the values within a data type (or data row if ‘Use Row Color Scale’ is selected) are constant, the scaled value for heatmap visualization is set to 0.5.
The user can restrict the number of cell lines to those that have the highest or lowest response values by selecting Number of High/Low Response Lines to Display. The user can download the heatmap related data by clicking on Download Heatmap Data.
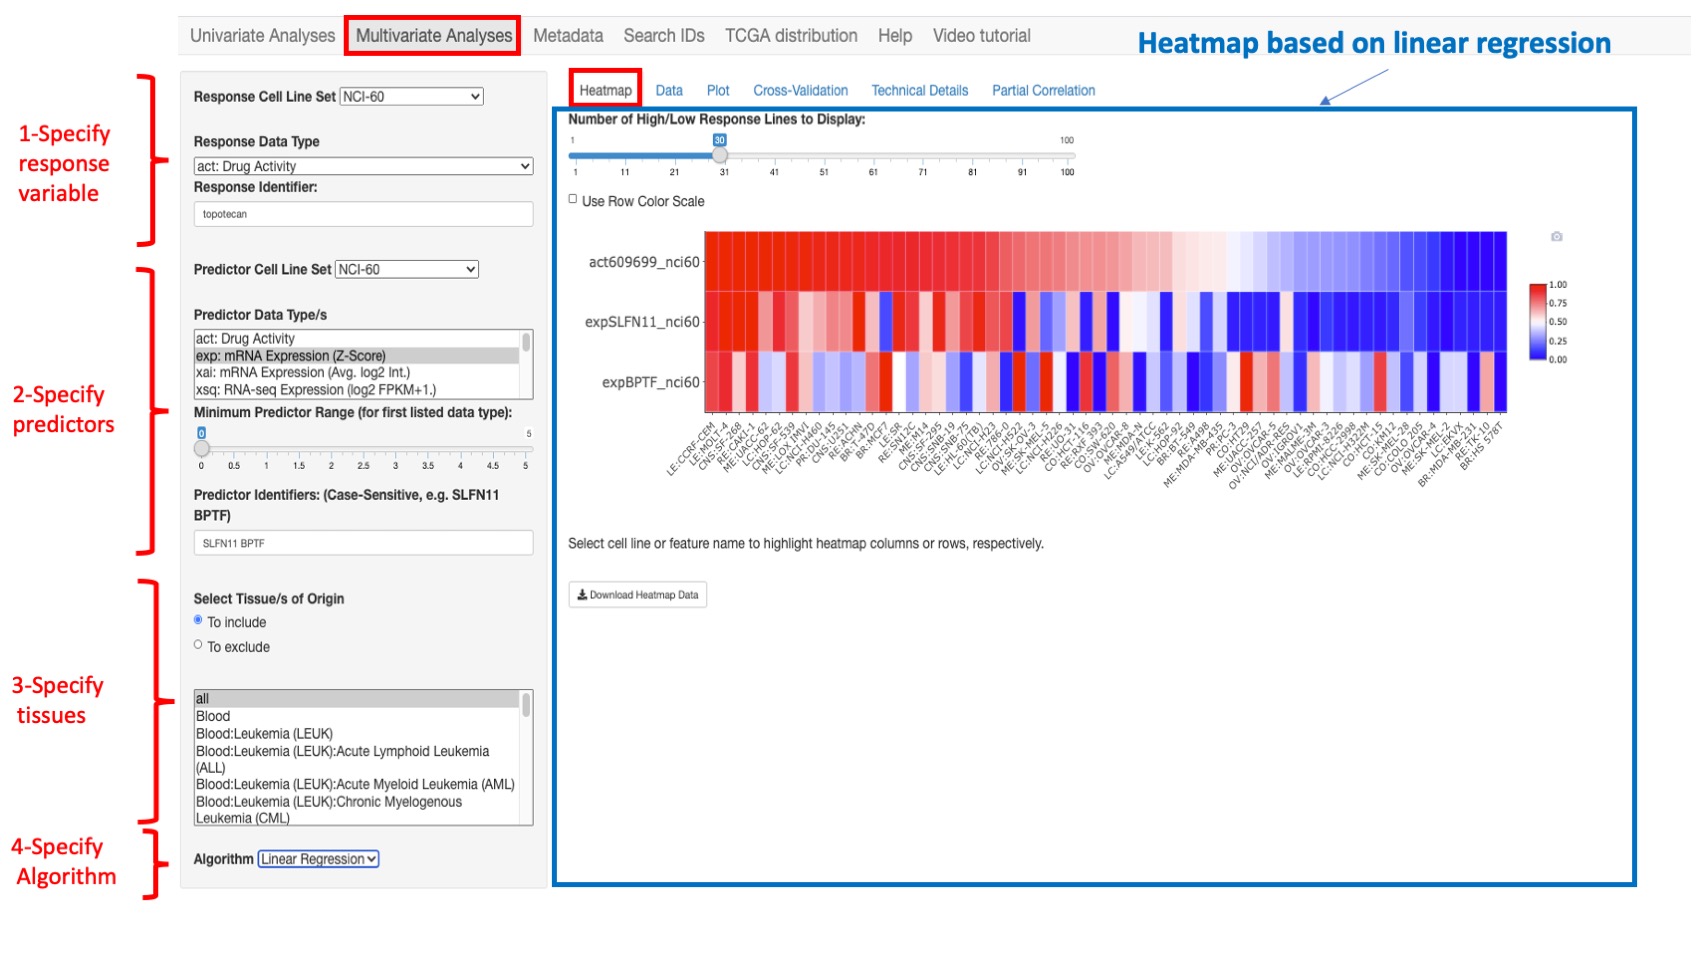
Figure 6: An example heatmap where we selected topotecan as a response variable and SLFLN11 and BPTF gene expression as predictor variables. In this example, we chose to display only 60 cell lines that have the most 30 highest and 30 lowest values for topotecan activity.
If the Lasso algorithm is selected (see below) more predicted variables are shown (STK17B and ABCD3 are added)
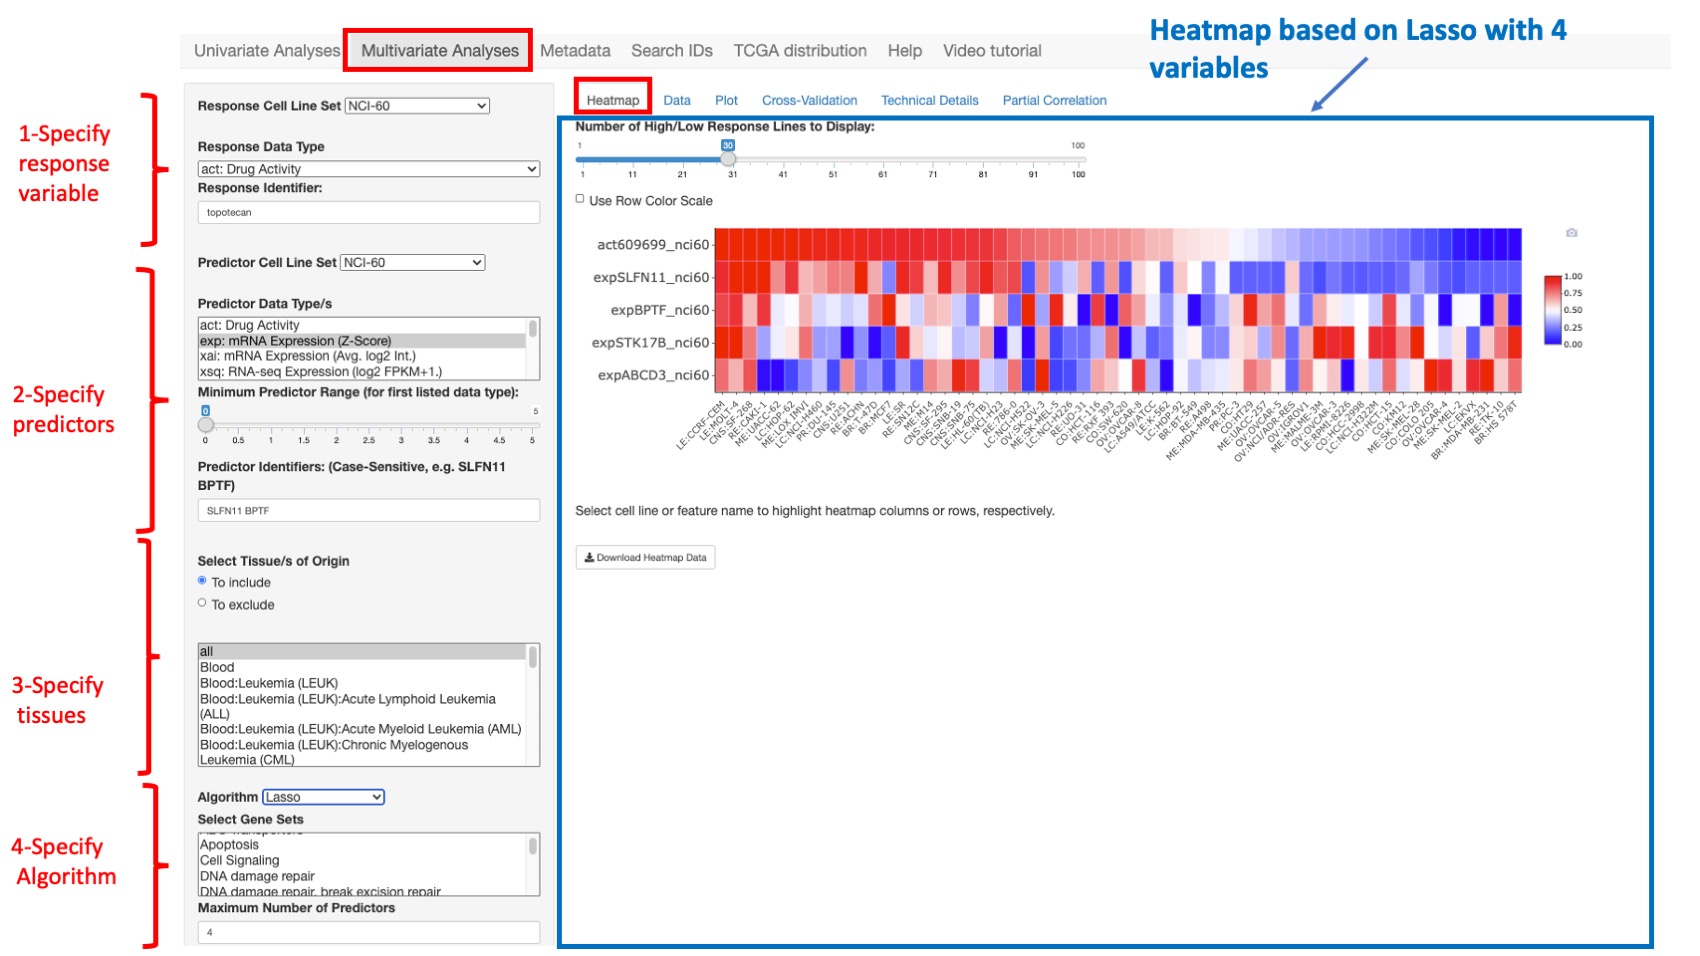
Figure 7: Same example as previous figure with the lasso algorithm
Data
This option shows the detailed data for the model variables for each cell line. Both the 10-fold cross validation (CV) as well as the predicted responses are given. The data is displayed as a table with filtering options for each column.
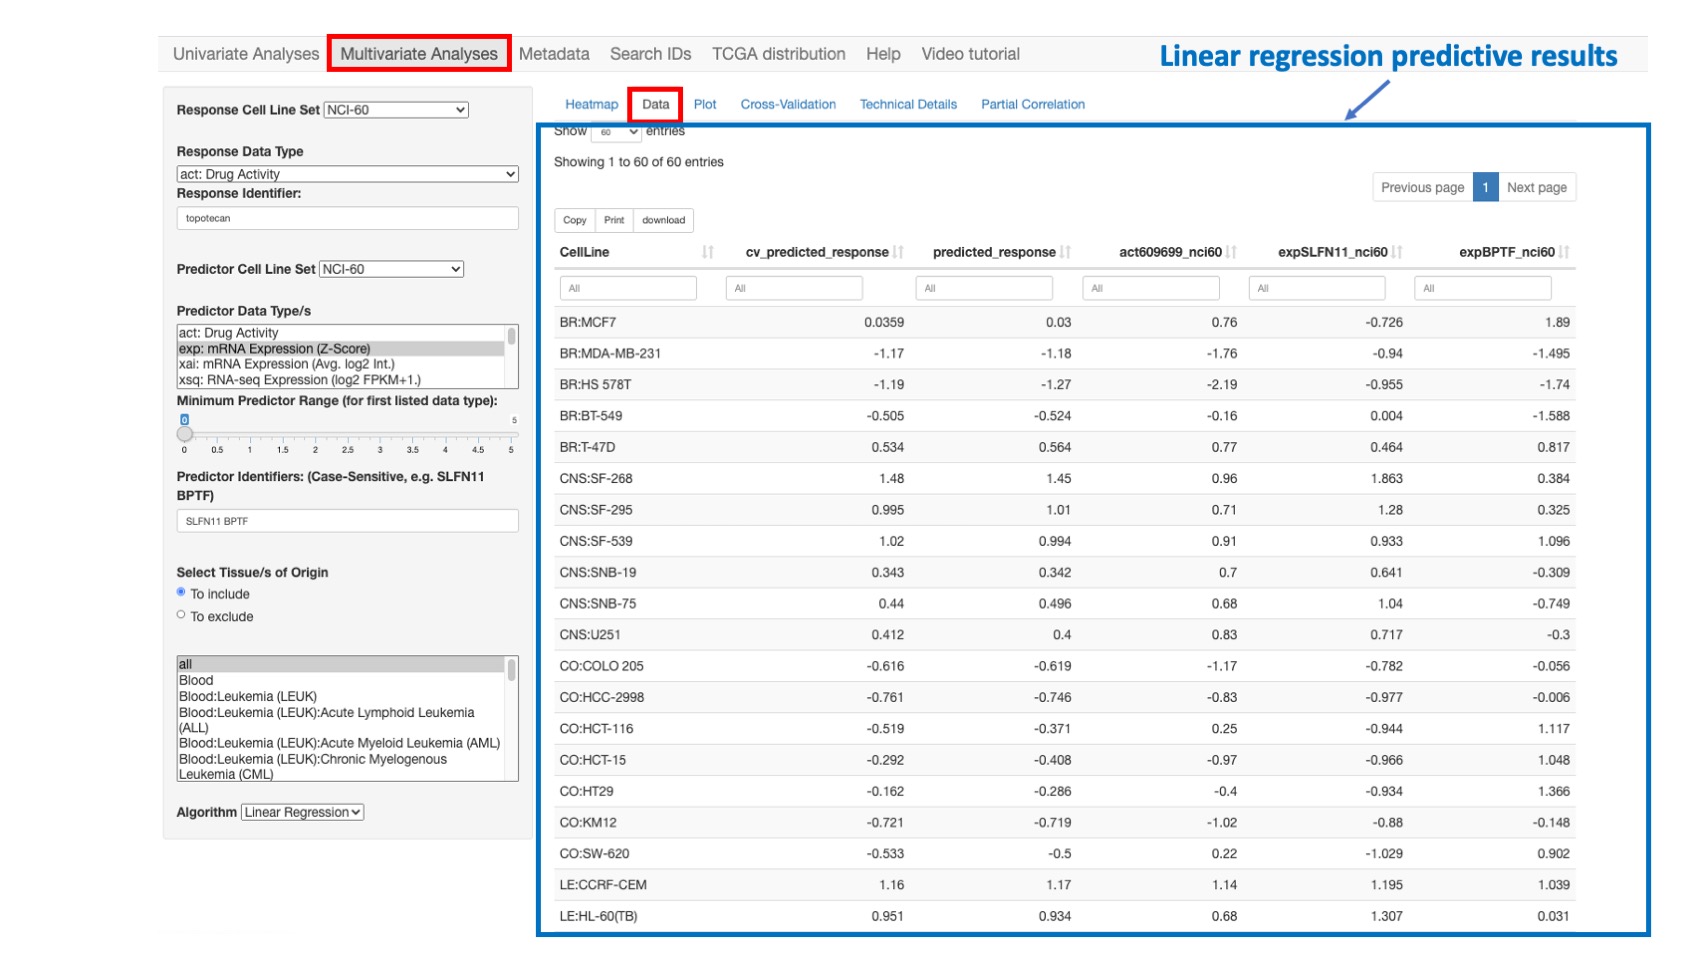
Figure 8: Data related to the simple linear regression model presented in the previous section.
Plot
This option enables one to plot and compare the observed response values (y-axis) versus the predicted response values (x-axis). The predicted response values are derived from a linear regression model fit to the full data set.
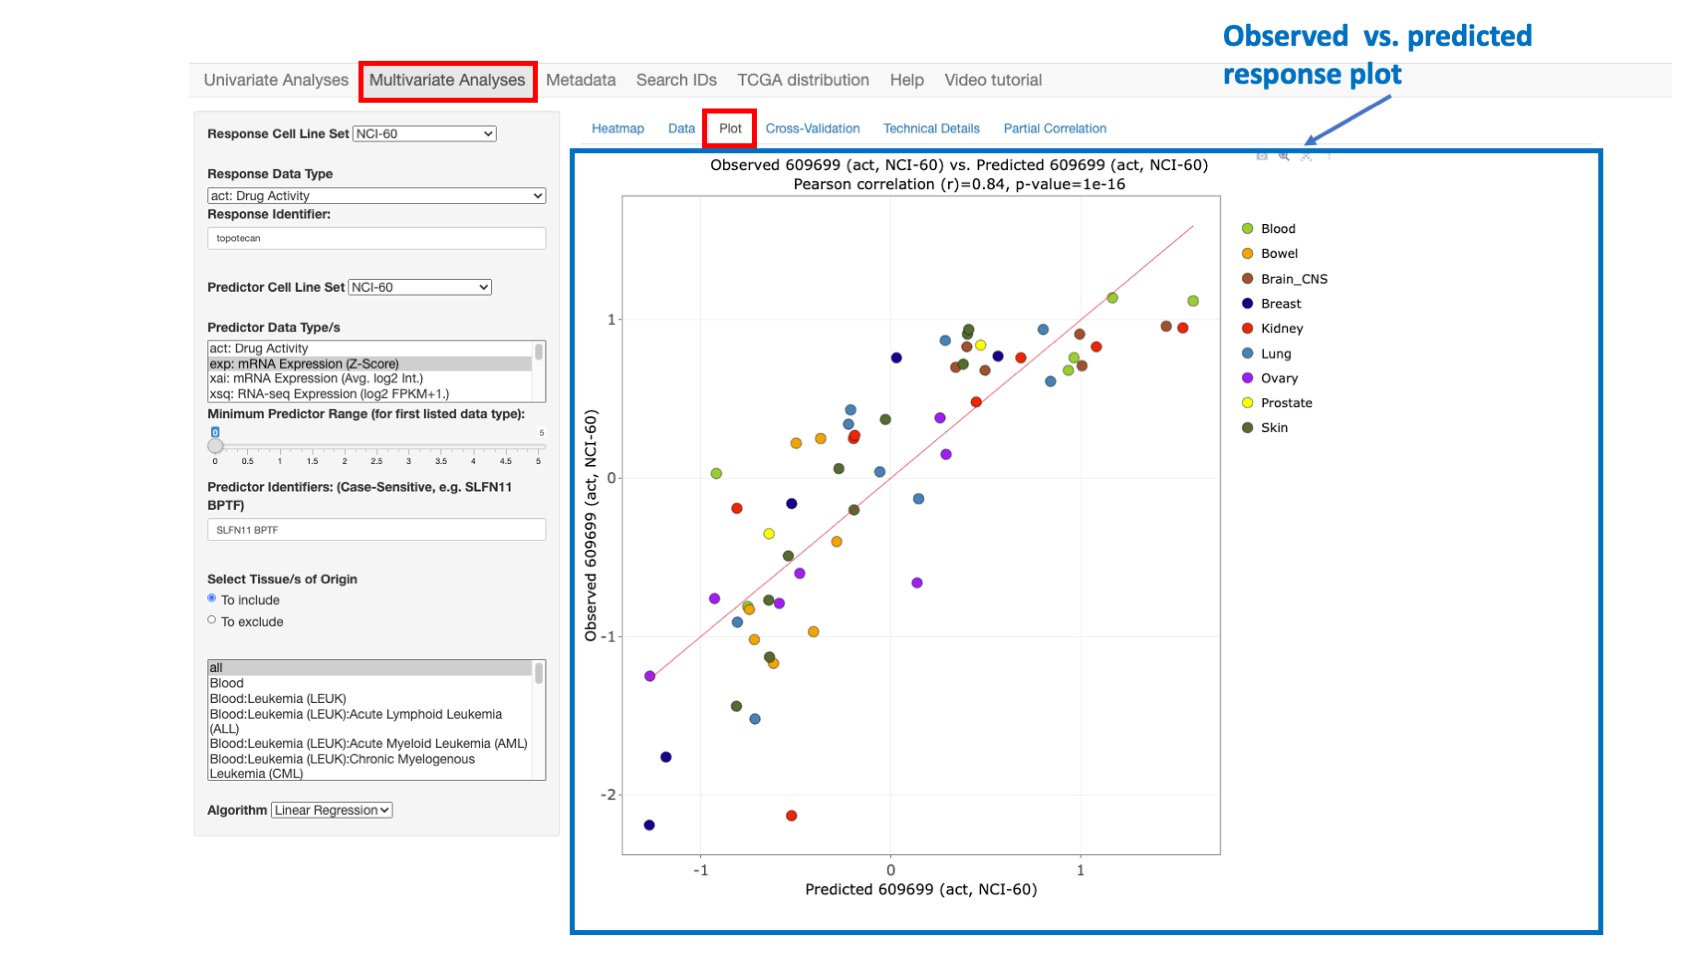
Figure 9: Plot comparing Topotecan observed vs. predicted activity with high correlation value of 0.84
Cross-Validation
This option enables plotting the observed response values (y-axis) versus the 10-fold cross-validation predicted response values (x-axis). With this approach, the predicted response values are obtained (over 10 iterations) by successively holding out 10% of the cell lines and predicting their response using a linear regression model fit to the remaining 90% of the data. After all 10 folds have been done, each sample has one cross-validated prediction (since each sample gets in the test set once). We compute the correlation between these cross-validated predictions and the true responses.
Cross-validation is widely used in statistics to assess model generalization to independent data – with the caveat that the independent data must still share the same essential structure (i.e., probability distribution) as the training data. It can also indicate possible overfitting of the training data, such as when the observed versus full data set model-predicted correlation (shown in ‘Plot’) is substantially better than the observed versus cross-validation predicted correlation (shown in ‘Cross-Validation’).
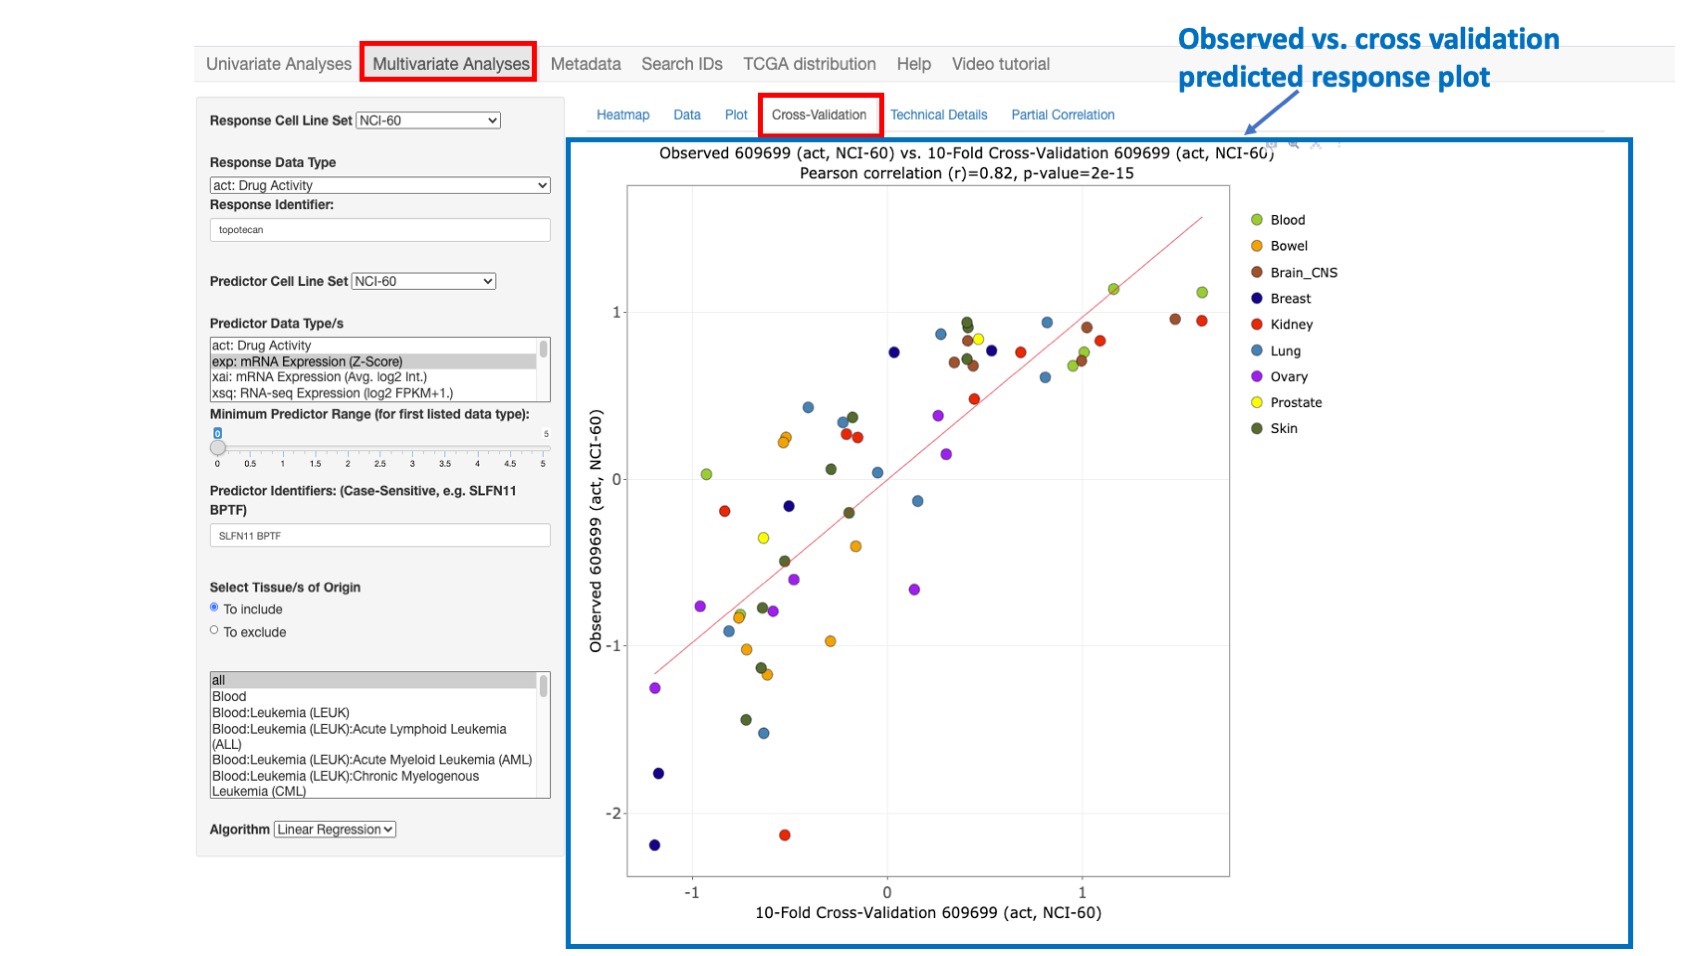
Figure 10: Plot comparing Topotecan observed vs. cross-validation predicted activity with still high correlation value of 0.82
Technical Details
This option enables the user to view the R statistical and other technical details related to the predicted response model. To save, these results may be copied and pasted into the document or spreadsheet of your choice.
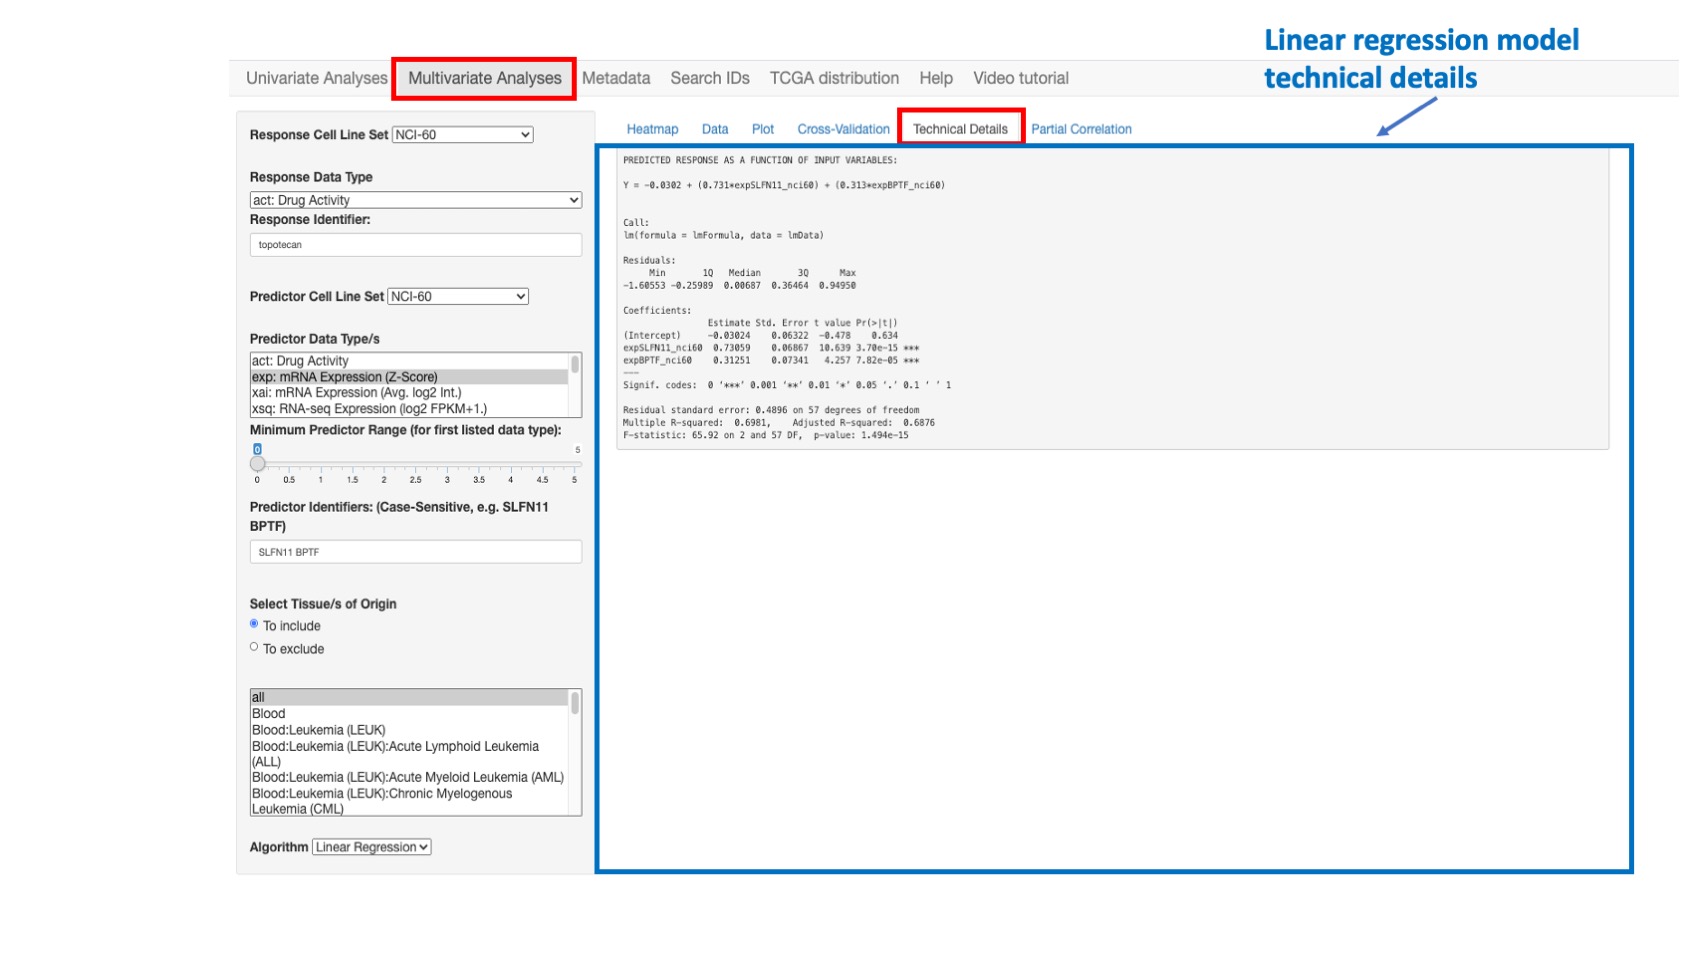
Figure 11: Example of regular regression model fitting results
Partial correlations
This function is used to identify additional predictive variables for a multivariate linear model. Conceptually, the aim is to identify additional predictive variables that are independently correlated with the response variable, after accounting for the influence of the existing predictor set. Computationally, a linear model is fit, with respect to the existing predictor set, for both the response variable and each candidate predictor variable. The partial correlation is then computed as the Pearson’s correlation between the resulting pairs of model residual vectors (which capture the variation not explained by the existing predictor set). The p-values reported for the correlation and linear modeling analyses assume multivariate normal data. The two-variable plot feature of CellMinerCDB allows informal assessment of this assumption, with clear indication of outlying observations. The reported p-values are less reliable as the data deviate from multivariate normality.
In order to run a partial correlation analysis, the user should first construct a linear model (providing response and predictor variables as explained earlier - steps 1 to 4 in figure below-) and then:
- Select Gene Sets: The gene selection is based on curated gene sets. Here the user can select one or more gene sets and even all genes (step 5 in figure below)
- Select Data types: the user can select one or more data type such as gene expression, methylation or copy number variation (step 6 in figure below)
- optionally, specify the Minimum Range for the first listed data type (step 7 in figure below)
- And finally click on button run (step 8 in figure below).
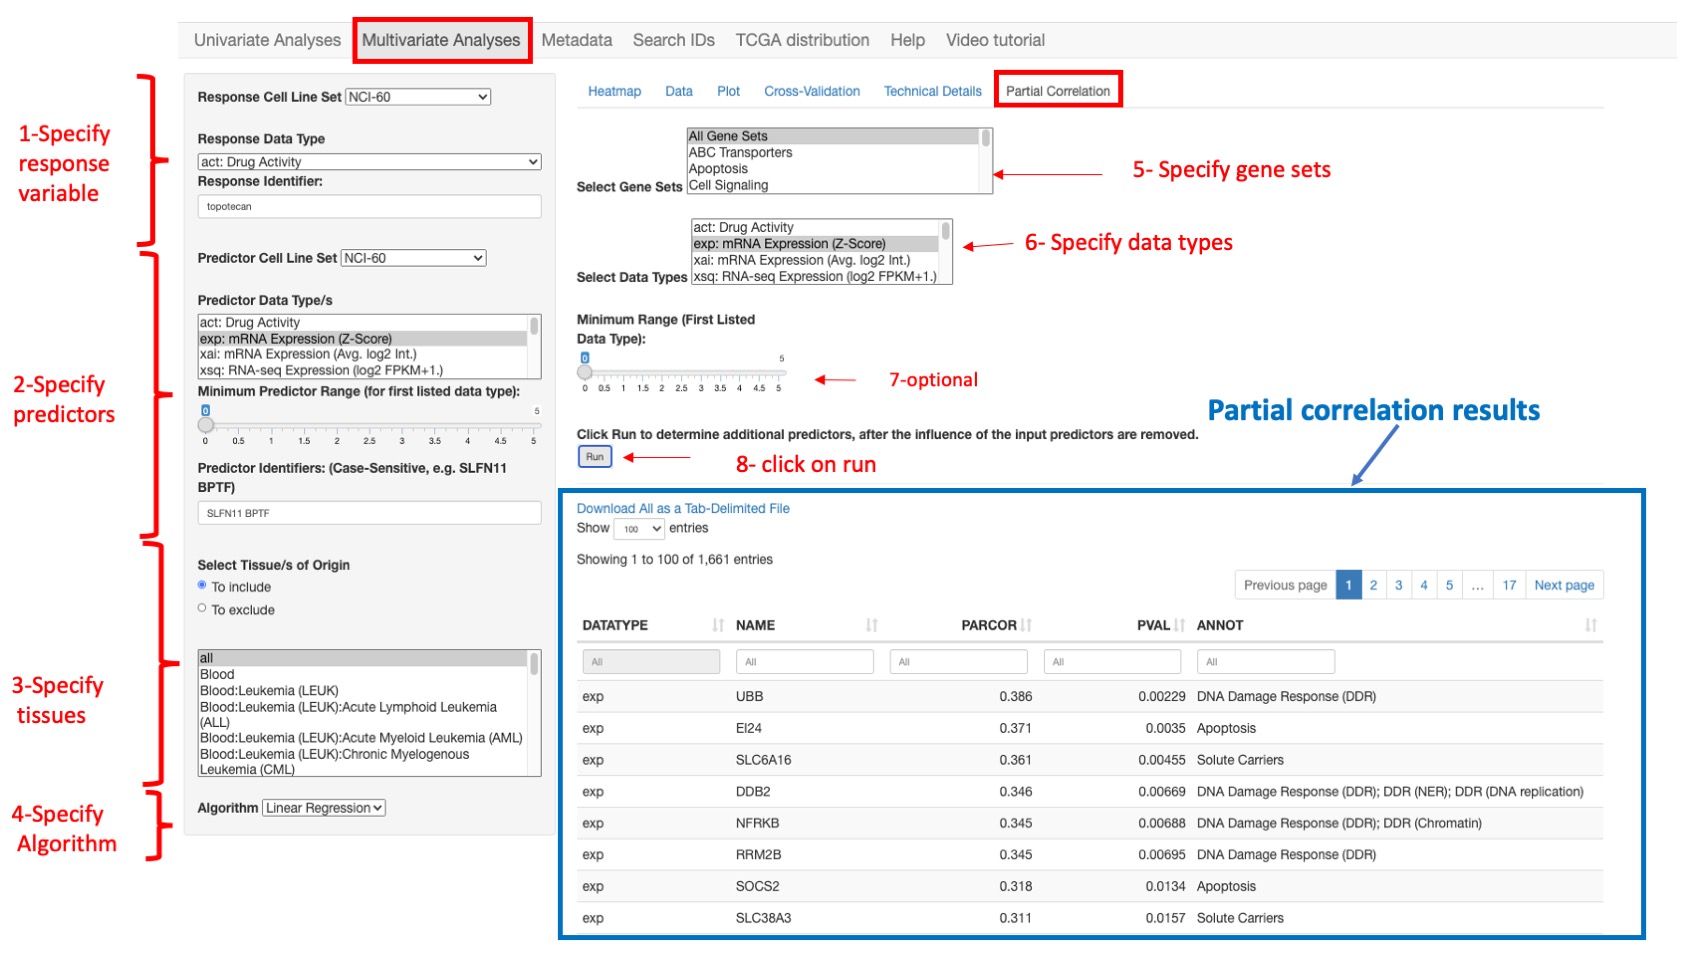
Figure 12: An example of partial correlation results for selected gene expression data using all gene sets.
Exploratory workflow
Mutilple data analysis workflows may be used dependent of the question being asked. A typical workflow:
- Check the relationship between two variables [2D plot]. Example: SLFN11 transcript expression and topotecan drug activity.
- Examine what else might be associated with either the x-axis or y-axis variable [Pattern Comparison]. Example: considering potential biological affects, TGFBR3 (an apoptosis factor) and BPTF (a chromatin factor) transcript expression might be considered candidates for affecting topotecan activity.
- Upon finding two or more associations with single 'response' variable through [Pattern Comparison/2D Plot], check if they complement one another in a multivariate model [Regression Models]. Example: Starting with the dominant SLFN11, adding TGFBR3 does not add to the regression model, but BPTF does.
- Repeat the above steps as needed.
Metadata
This option enumerates for each cell line set, the available data types that could be queried within the app providing the data type abbreviation or prefix, description, feature value unit (z-score, intensity, probability …), platform or experiment and related publication reference (pubmed). First the user should specify the Cell Line Set or data source to view all available associated data types. Then he can download data via: Select Data Type to Download and then click on Download Data type and/or Download Data Footnotes to download any data or footnotes for the selected cell line set. Finally the user has the option to Download current cell line set information and Download drug synonyms table with matching IDs for all cell line sets by clicking respectively on Download cell line annotation and Download table.
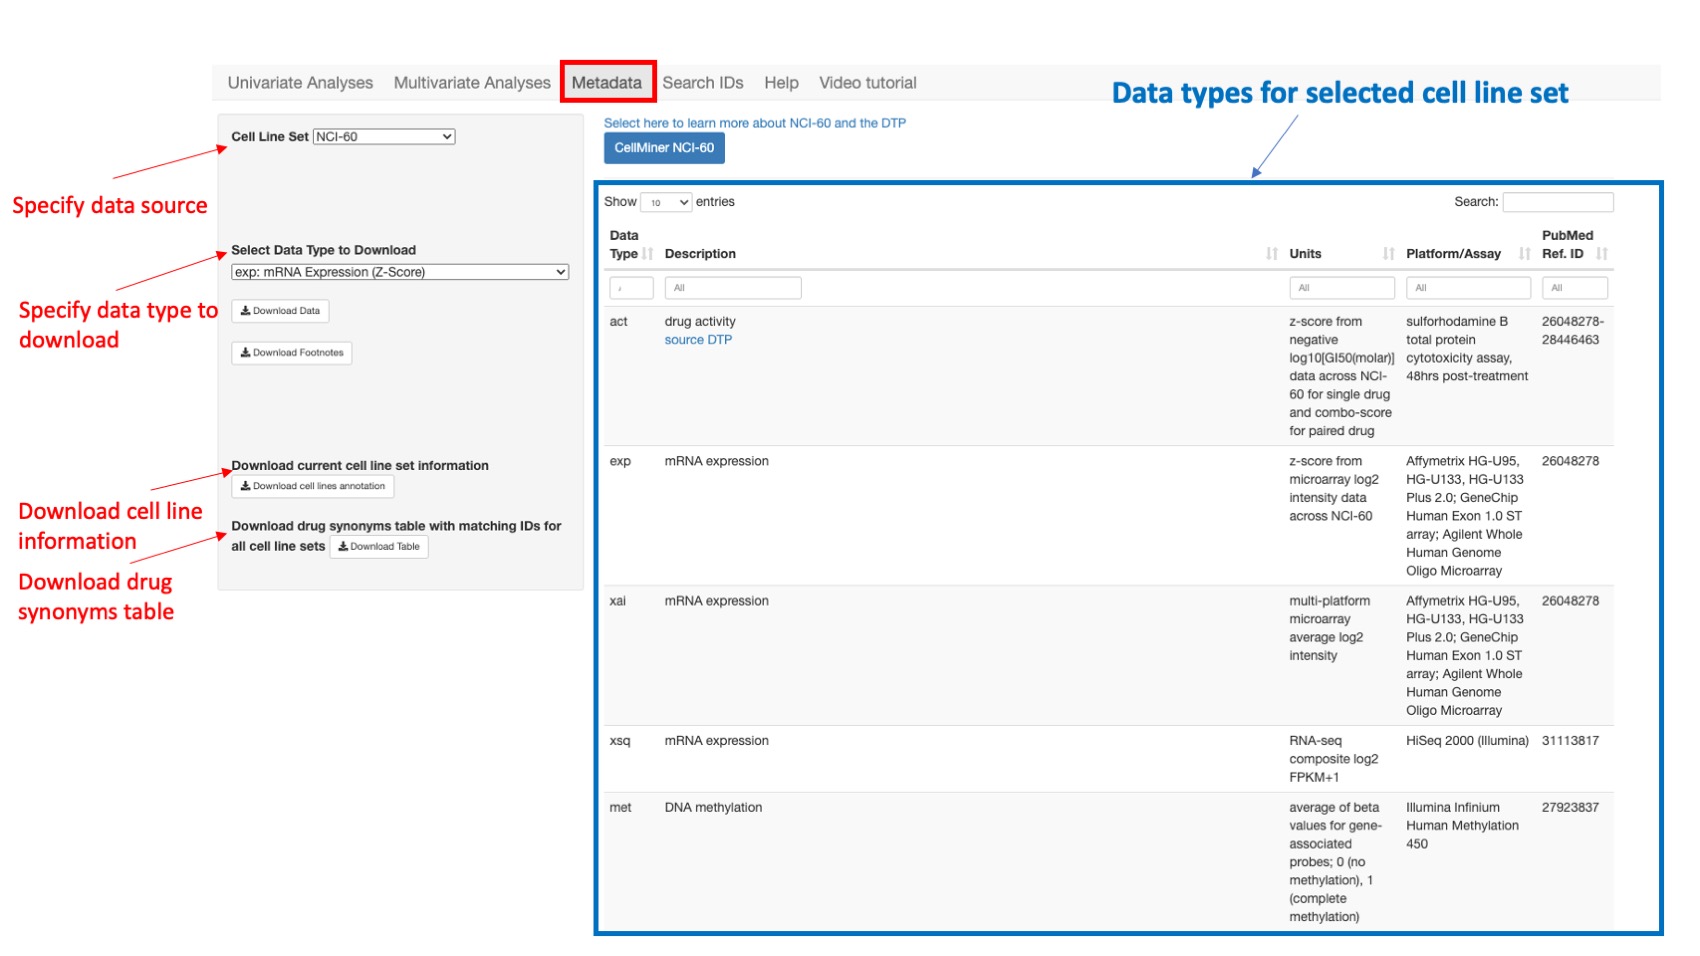
Figure 13: Shows all data types for NCI60
Search IDs
This page lists the identifiers (ID) available in the selected data source for use in the univariate analysis or Multivariate Analysis. The user chooses:
- Cell Line Set selects the data source. The user can choose: NCI60, CCLE, GDSC, CTRP or NCI/DTP SCLC (see Data Sources for more details).
- Select Data Type selects the data type to query. The options for this vary dependent on the source selected above, and appear in the x-Axis Data Type dropdown. See the Metadata tab for descriptions and abbreviations.
This enables to search all related ID for each combination. For the molecular data, the gene names (ID) and specific data type information are provided. For the drugs and compounds, the identifiers (ID), Drug name (when available), and Drug MOA (when available) are displayed. The user can scroll down the whole list of IDs, or search specific ID(s) by entering a value in the header of any column.
Drug IDs
For the NCI-60 and NCI/DTP SCLC, the drug identifiers (ID) are NSC's or names. For the CCLE, GTRP, and CTRP, the drug identifiers are the Drug names.
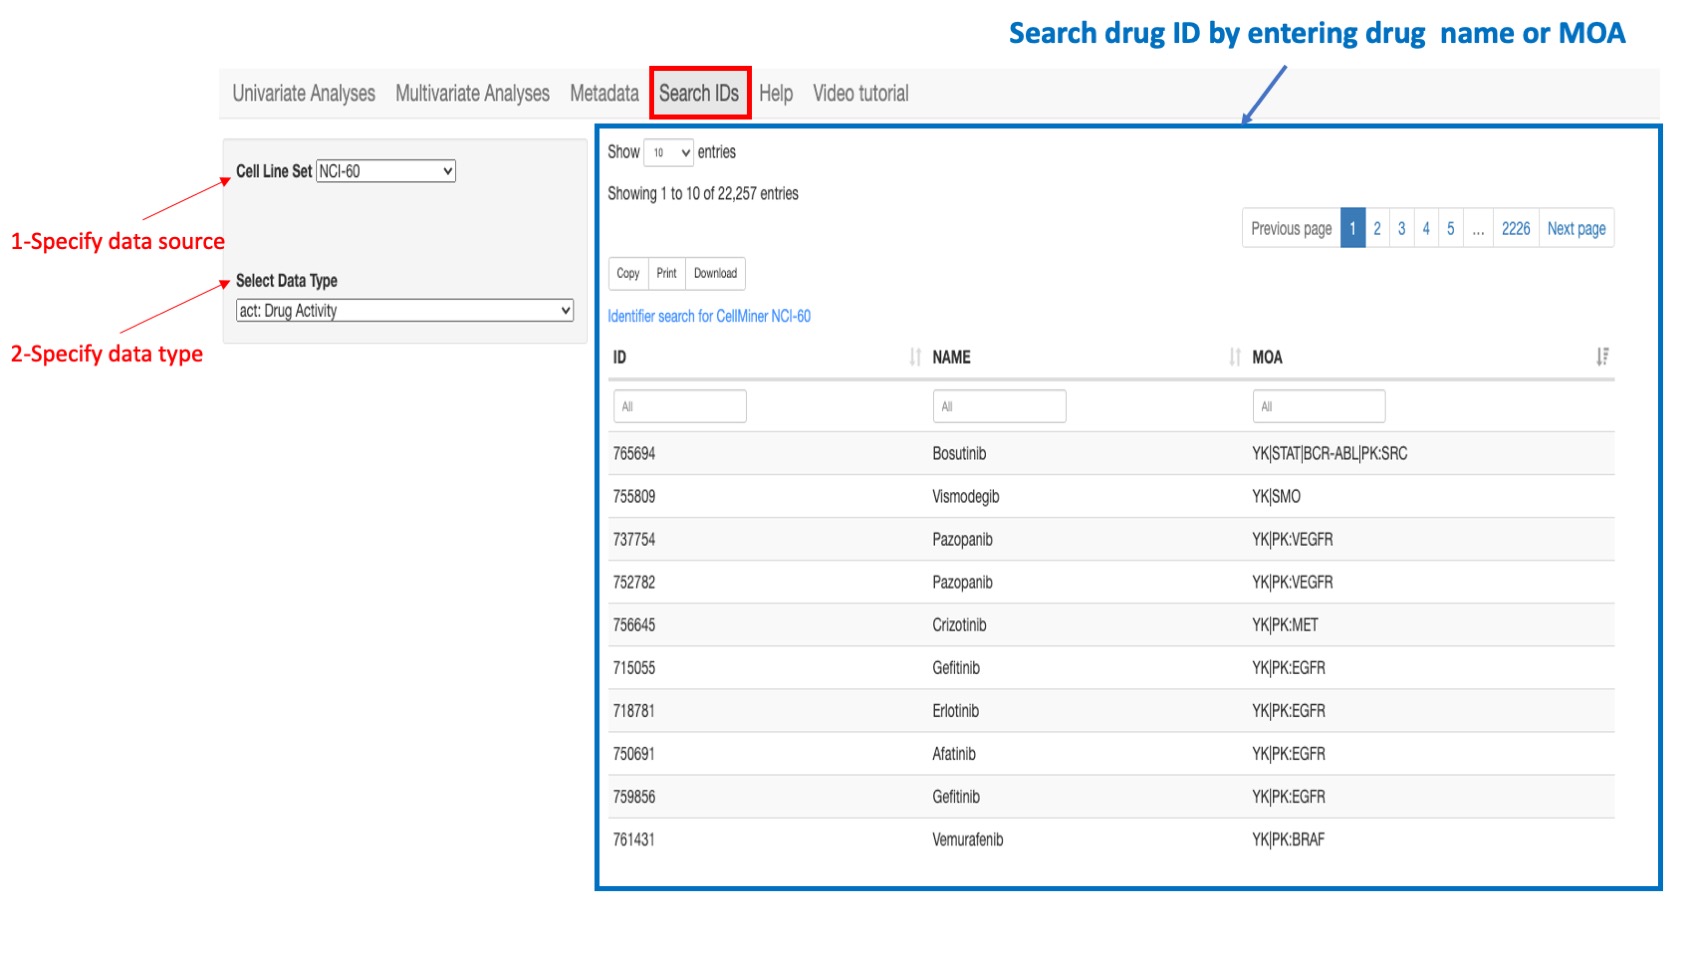
Figure 14: Example of a search: if looking for a drug ID in the NCI-60 select “NCI-60” as the cell line source and select “Drug Activity” as the data type. You can type in search box of column “Drug name” or “MOA”.
Gene IDs
For all data sources, the gene ID is the Hugo gene symbol however the application also recognizes any synonym or previous symbol (alias) that is included in the Hugo database.
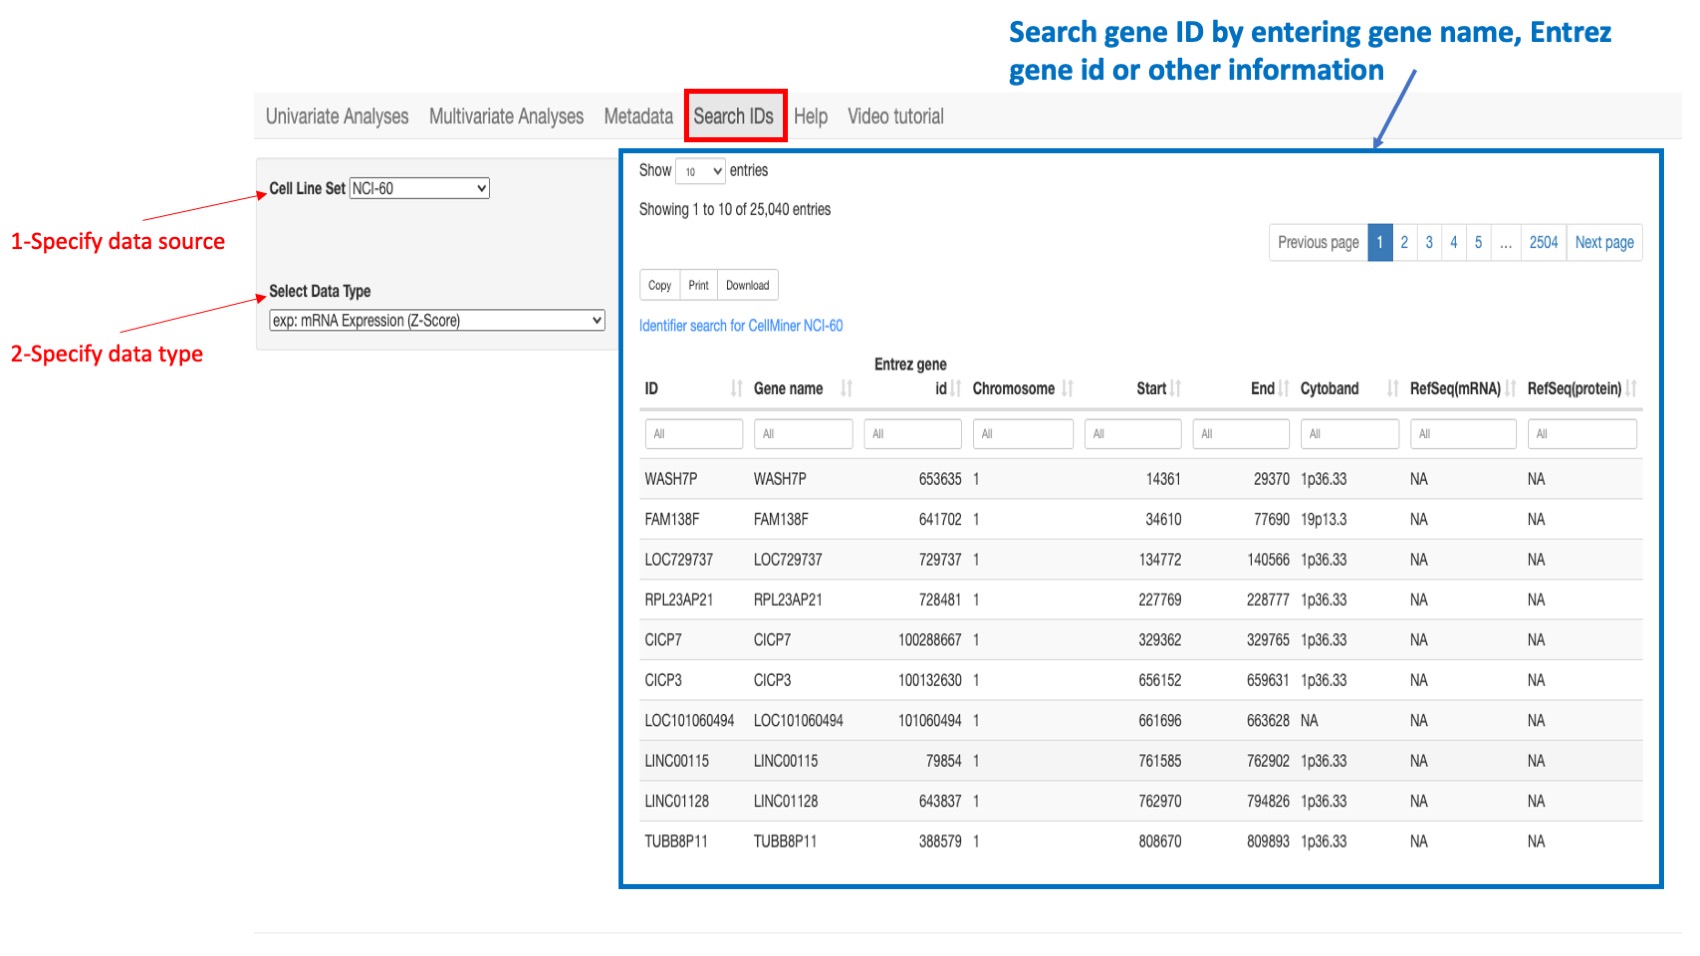
Figure 15: Example of a search: if looking for a gene ID in the NCI-60 select “NCI-60” as the cell line source and select “gene expression” as the data type. You can type in search box of column “gene name” or “entrez gene id” or “Chromosome”…
Navigation guide
Multiple selection
In order to select multiple choice from a list, use “command” button for Mac or “alt” button for PC and then click
X-axis or Y-axis range
You can change the x-axis or y-axis lower or higher value to have different views of the displayed plot.
Show color
It is a checkbox that enable and disable colors in the scatter plots
Contact/Feedback
Please send comments and feedback to
- fathi.elloumi AT nih.gov
- aluna AT jimmy.harvard.edu
- vinodh.rajapakse AT nih.gov
Data Sources
CellMinerCDB integrates data from the following sources, which provide additional data and specialized analyses.
- CellMiner NCI-60 (NCI60)
- DTP NCI-60 Almanac (Almanac)
- Broad/Novartis Cancer Cell Line Encyclopedia (CCLE)
- Broad Cancer Therapeutics Response Portal (CTRP)
- Sanger/Massachusetts General Hospital Genomics of Drug Sensitivity in Cancer (GDSC)
- NCI/DTP Small Cell Lung Cancer Project (SCLC)
- MD Anderson Cell Lines Project
- Achilles Project
- PRISM Project
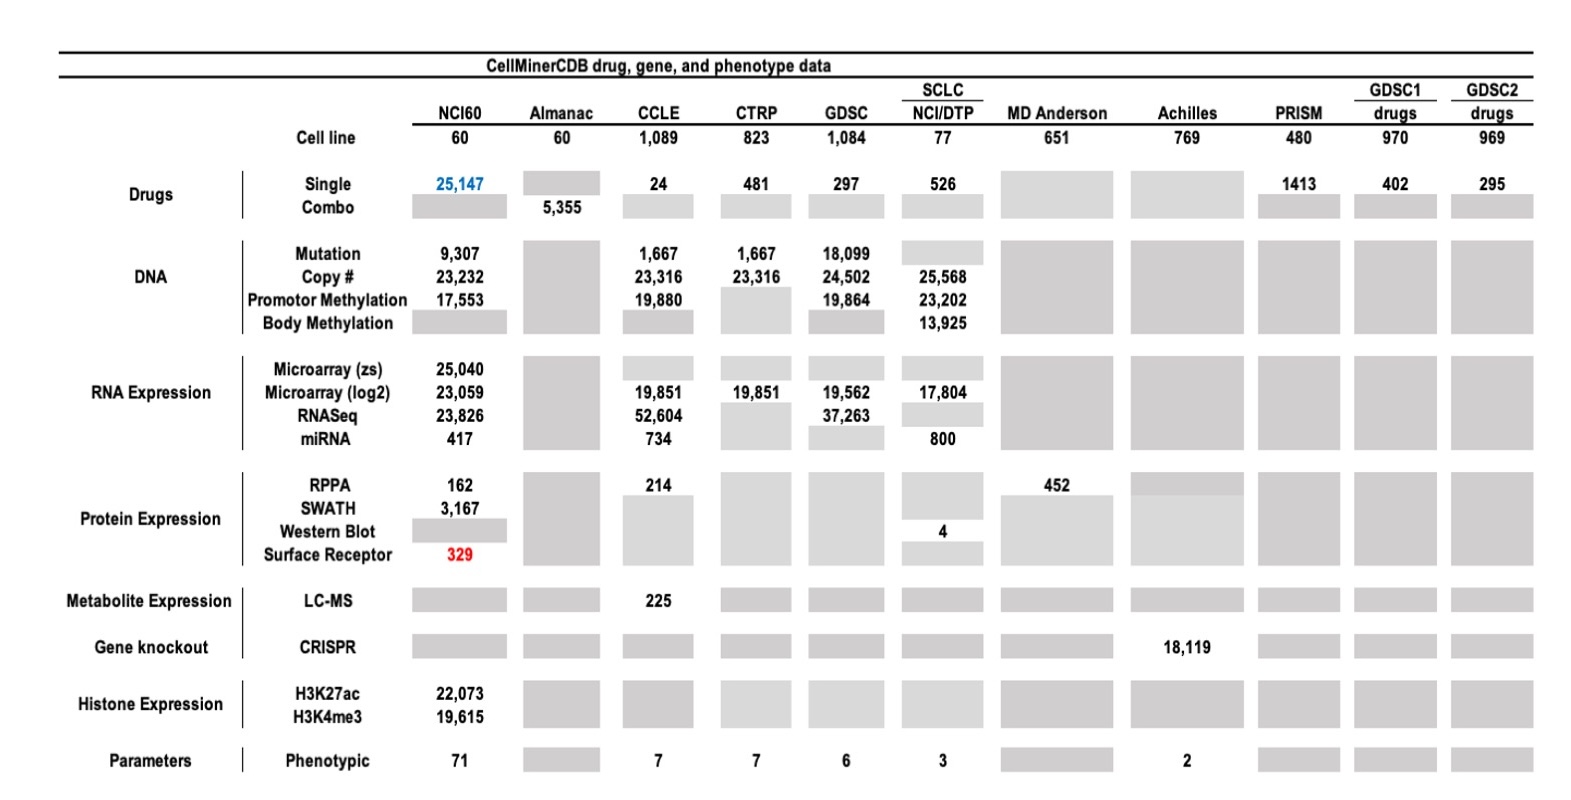 Figure 16: Summary of Molecular Drug Activity Data for the six data sources currently included in CellMinerCDB. For the drug data, combo is a two-drug combinations from the NCI60 Almanac. For molecular data types, the numbers indicate the number of genes with a particular data type. Gene level mutation and methylation were computed using specific scripts described in cellminercdb paper (see reference below). A Grey tab indicates that is no data available. Numbers highlighted in blue indicates change of number of features compare to the previous release version whereas numbers highlighted in red indicates number of new features.
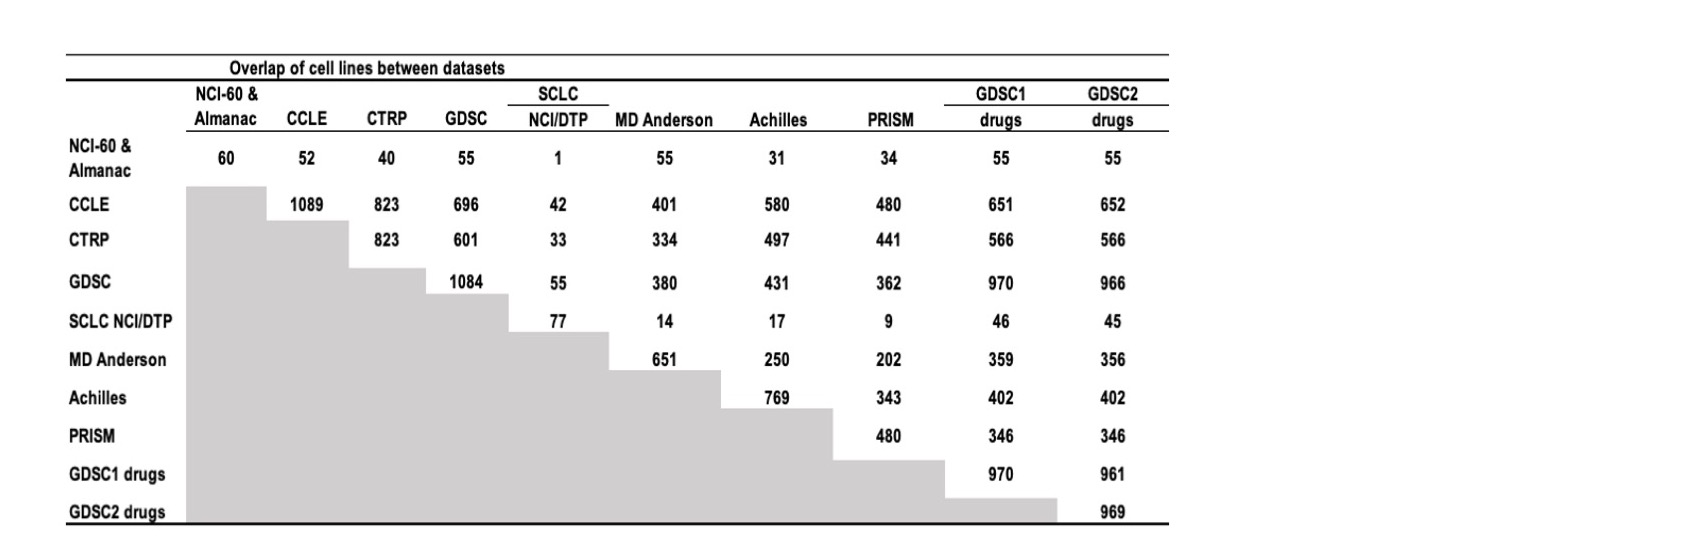 Figure 17: Cell line overlaps between data sources.
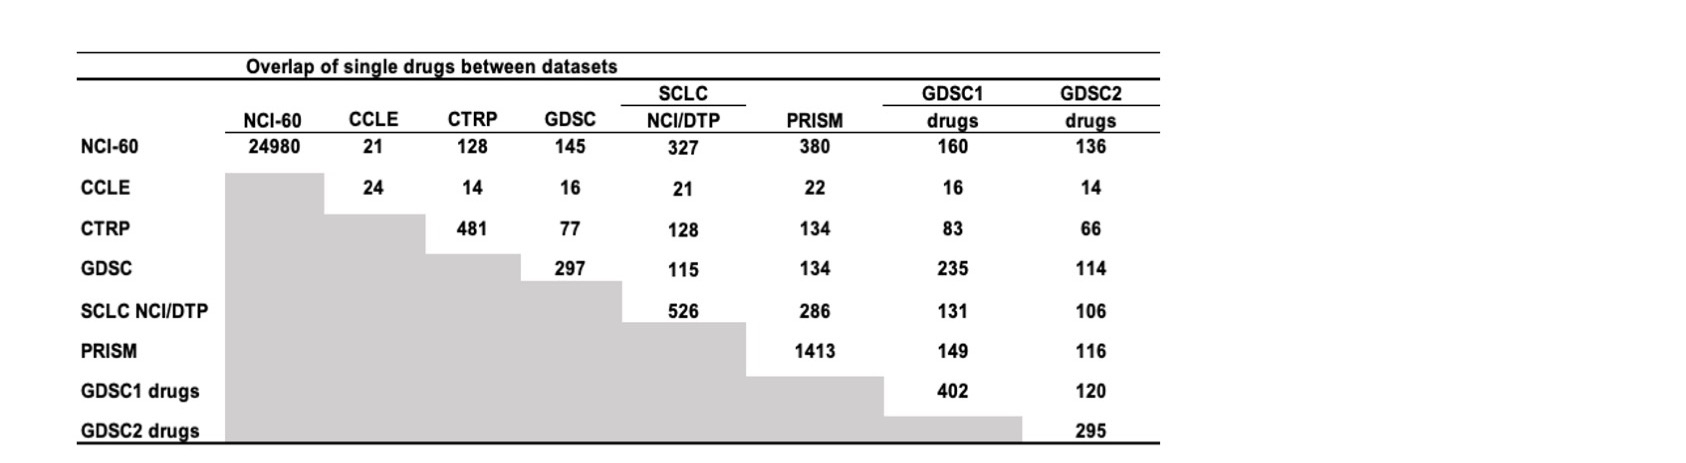 Figure 18: Drug overlaps between data sources.
About the Data
For specific information about the data made available for particular sources, please refer to the 'Metadata' navbar tab.
Drug mechanism of action details:
Gene sets used for annotation of analysis results or algorithm input filtering were curated by the NCI/DTB CellMiner team, based on surveys of the applicable research literature.
About CellMinerCDB
The CellMinerCDB application is developed and maintained using R and Shiny by:
- Augustin Luna; Research Fellow, Biostatistics and Computational Biology, Dana-Farber Cancer Institute, Harvard Medical School
- Vinodh N. Rajapakse; Postdoctoral Fellow, Developmental Therapeutics Branch, National Cancer Institute
- Fathi Elloumi; Bioinformatics Software Engineer, Developmental Therapeutics Branch, National Cancer Institute
NCI-DTB Genomics and Bioinformatics Group
- William C. Reinhold
- Sudhir Varma
- Margot Sunshine
- Fathi Elloumi
- Yanghsin Wang
- Lisa Loman (Special Volunteer)
- Fabricio G. Sousa
- Kurt W. Kohn
- Yves Pommier
Biostatistics and Computational Biology, Dana-Farber Cancer Institute, Harvard Medical School
- Chris Sander
MSKCC Computational Biology
- Jianjiong Gao
- Nikolaus Schultz
References
Shankavaram UT, Varma S, Kane D, Sunshine M, Chary KK, Reinhold WC, Pommier Y, Weinstein JN. CellMiner: a relational database and query tool for the NCI-60 cancer cell lines. BMC Genomics. 2009 Jun 23;10:277. doi: 10.1186/1471-2164-10-277.
Reinhold WC, Sunshine M, Liu H, Varma S, Kohn KW, Morris J, Doroshow J, Pommier Y. CellMiner: a web-based suite of genomic and pharmacologic tools to explore transcript and drug patterns in the NCI-60 cell line set. Cancer Res. 2012 Jul 15;72(14):3499-511. doi: 10.1158/0008-5472.CAN-12-1370.
Reinhold WC, Sunshine M, Varma S, Doroshow JH, Pommier Y. Using CellMiner 1.6 for Systems Pharmacology and Genomic Analysis of the NCI-60. Clin Cancer Res. 2015 Sep 1;21(17):3841-52. doi: 10.1158/1078-0432.CCR-15-0335. Epub 2015 Jun 5.
Luna A, Rajapakse VN, Sousa FG, Gao J, Schultz N, Varma S, Reinhold W, Sander C, Pommier Y. rcellminer: exploring molecular profiles and drug response of the NCI-60 cell lines in R. Bioinformatics. 2015 Dec 3. pii: btv701.
Rajapakse VN, Luna A, Yamade M, Loman L, Varma S, Sunshine M, Iorio F, Elloumi F, Aladjem MI, Thomas A, Sander C, Kohn KW, Benes CH, Garnett M, Reinhold WC, Pommier Y. CellMinerCDB for Integrative Cross-Database Genomics and Pharmacogenomics Analyses of Cancer Cell Lines. iScience, Cell Press. 2018 Dec 12.
Reinhold WC, Varma S, Sunshine M, Elloumi F, Ofori-Atta K, Lee S, Trepel JB, Meltzer PS, Doroshow JH, Pommier Y. RNA sequencing of the NCI-60: Integration into CellMiner and CellMiner CDB. Cancer Res. 2019 May 21. pii: canres.2047.2018. doi: 10.1158/0008-5472.CAN-18-2047.
Luna A, Elloumi F, Varma S, Wang Y, Rajapakse VN, Aladjem MI, Robert J, Sander C, Pommier Y, Reinhold WC. CellMiner Cross-Database (CellMinerCDB) version 1.2: Exploration of patient-derived cancer cell line pharmacogenomics. Nucleic Acids Res. 2021 Jan 8;49(D1):D1083-D1093. doi: 10.1093/nar/gkaa968. PMID: 33196823; PMCID: PMC7779001.
Related links
Release notes
- Version 2.0
- Version 1.9
- Version 1.8
- Version 1.7
- Version 1.6
- Version 1.5
- Version 1.4
- Version 1.3
- Version 1.2
- Version 1.1
- Version 1.0
Version 2.0
April 2024:
- Release of NCI60 drug (that passed QC) and phenotypic data from cellminer database v2.12
- New NCI60 protein (surface receptor) data
- Easy selection of signature in the univariate analysis
Version 1.9
October 2023:
- Release of NCI60 drug (that passed QC) and phenotypic data from cellminer database v2.11
Version 1.8
July 2023:
- New Common Drug pages
- Updated list of Triple Negative Breast cell lines
- New Replication Stress scores for all data sources with gene expression
Version 1.7
April 2023:
- Release of NCI60 drug (that passed QC) and phenotypic data from cellminer database v2.10
- Latest GDSC1 and GDSC2 drug data
- Updated version of cell line pages
- New Cell surface genes list (for Lasso)
- New Tree View for selecting Tissue of origin
Version 1.6
October 2022:
- Release of NCI60 drug (that passed QC) and phenotypic data from cellminer database v2.9
- New Cell lines information page
- New GDSC RNA-seq data
- New NCI SCLC body methylation data
- New NCI SCLC protein (western blot) data
Version 1.5
April 2022:
- Release of NCI60 drug (that passed QC) and phenotypic data from cellminer database v2.8.1
- New NCI60 H3K27ac histone data
- New NCI60 H3K4me3 histone data
- New PRISM BROAD-MIT drug data
- New Achilles (Crispr) gene data
- New Gene list for Multivariate Lasso model background list
- New NCI60 Replication Stress scores
- New functionality to search cell line within scatter plot
Version 1.4
October 2021:
- Release of NCI60 drug (that passed QC) and phenotypic data from cellminer database v2.7
Version 1.3
April 2021:
- New NCI60 drug (that passed QC) and phenotypic data from cellminer database v2.5
Version 1.2
September 2020: [pubmed: 33196823]
- New 1075 drug activiy and removed bad experiments for NCI60
- Updated Swath data for NCI60
- Added copy number and updated methylation for GDSC
- New RPPA protein data for CCLE
- New RPPA protein data from MD Anderson
- New pattern comparison across datasources
- New multivariate analysis across datasources
- New NAPY subtypes for SCLC cell lines
- New annotation for Triple Negative Breast Cancer cell lines
- New Antigen Presentation Machinery (APM), Epithelial-Mesenchymal Transition (EMT) and Neuro-Endocrine (NE) signatures scores
- Improved download data button
Version 1.1
May 2019: [pubmed: 31113817]
- New NCI60 RNASeq data
- New SCLC microRNA data
- New modal start video
- New tab for tutorial video
- Increased size of title, x-axis and y-axis legends
- Improved pattern comparison speed by caching main functions
- Implemented leaving federal Javascript pop-up dialog
Version 1.0
December 2018: [pubmed: 30553813]
- Official lunch of website
- Data sources are NCI60, CCLE, CTRP, GDSC NCI SCLC and NCI Almanac
- Integrated new automatic gene search by synonyms in univariate analysis
- Added a new menu option to display correlation values by tissue of origin
- Made option to download any dataset in Metadata tab
CellMinerCDB: Cancer Cell Line Pharmacogenomics Exploration
CellMiner Cross-Database (CellMinerCDB, https://discover.nci.nih.gov/cellminercdb) allows integration and analysis of molecular and pharmacological data within and across cancer cell line datasets. If you use content from this site, please cite: Luna A et al. 2021. PMID: 33196823, Rajapakse VN et al. 2018. PMID: 30553813, and Luna et al. 2016., PMID: 33196823.
CellMinerCDB: Common Cancer Drugs between data sources
CellMiner Cross-Database (CellMinerCDB, https://discover.nci.nih.gov/cellminercdb) allows integration and analysis of molecular and pharmacological data within and across cancer cell line datasets. If you use content from this site, please cite: Luna A et al. 2021. PMID: 33196823, Rajapakse VN et al. 2018. PMID: 30553813, and Luna et al. 2016., PMID: 33196823.
discover.nci.nih.gov
An official website of the National Institutes of Health